25 µΩ shunt resistor: Measured Specs & Performance Data
In bench tests spanning 0.1–1000 A, a 25 μΩ shunt produces millivolt-level drops (0.025 mV at 1 A, 0.25 mV at 10 A, 2.5 mV at 100 A, 12.5 mV at 500 A) while heating dominates long-term accuracy and linearity. This article presents measured specs, test methods, and practical guidance for engineers specifying a 25 μΩ shunt resistor with clear performance data for decision-making.
1 — Background: What a 25 μΩ shunt resistor is and when to use it
1.1 — Physical and electrical basics
A 25 μΩ shunt resistor is a low-value precision current sense element that converts high currents to small voltages for measurement. Common form factors include metal strip, foil, and bonded constructions using manganin or copper alloys optimized for low TCR and stability. Typical drops: see table below for current→voltage→power examples.
| Current (A) | Voltage (mV) | Power (W) |
|---|---|---|
| 0.1 | 0.0025 | 0.00000025 |
| 1 | 0.025 | 0.000025 |
| 10 | 0.25 | 0.0025 |
| 100 | 2.5 | 0.25 |
| 500 | 12.5 | 6.25 |
| 1000 | 25.0 | 25.0 |
1.2 — Typical specs to expect on datasheets
Datasheets list nominal resistance, tolerance (±0.1–1%), power rating, TCR (ppm/°C), thermal EMF, inductance, max continuous and peak current, and long‑term drift. For accuracy prioritize low TCR, low thermal EMF and tight initial tolerance. Power rating and cooldown characteristics determine usable continuous current and derating in confined enclosures.
2 — Measurement methodology & lab setup
2.1 — Recommended measurement hardware and connections
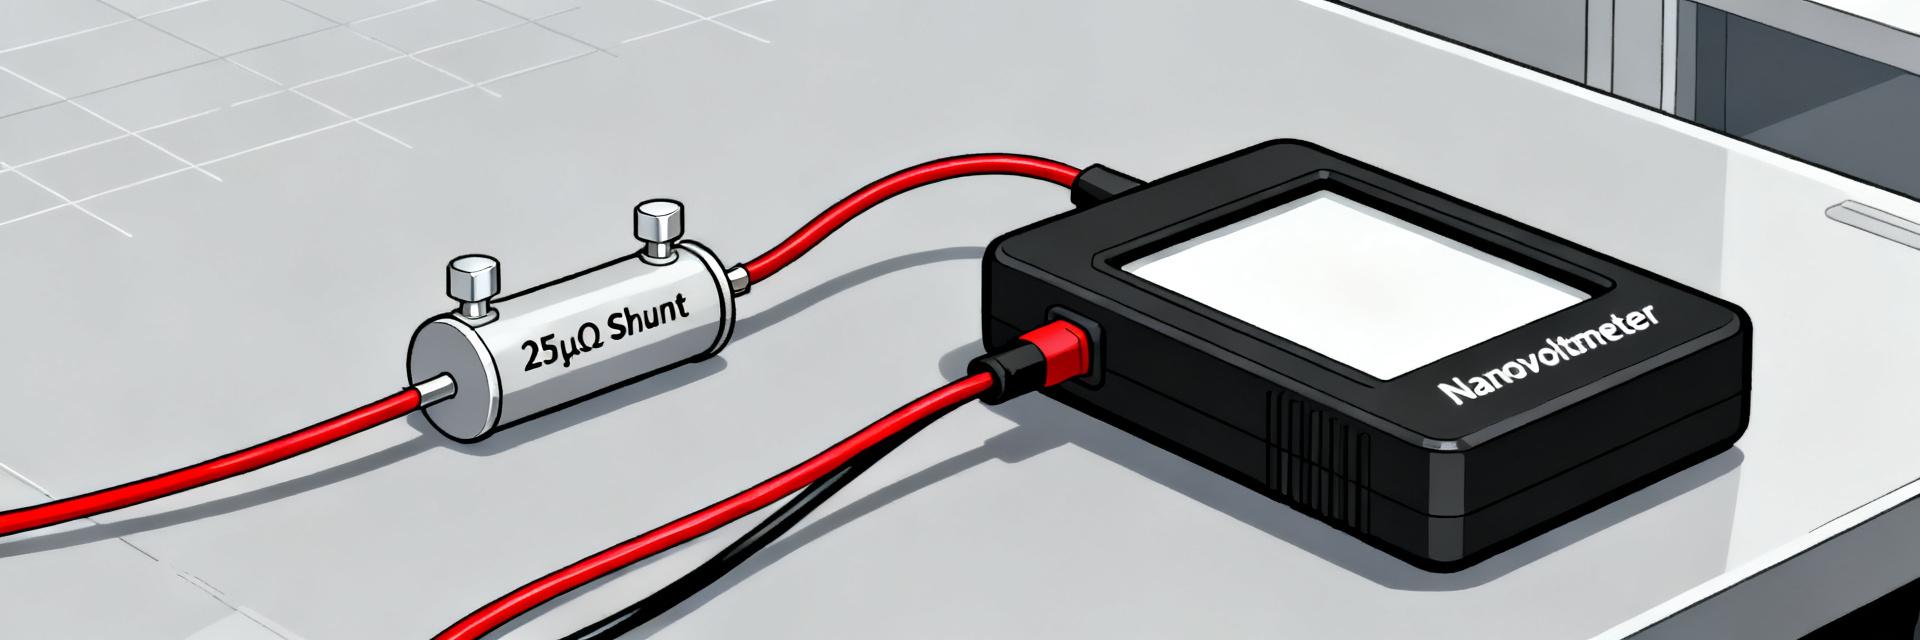
Use Kelvin 4‑wire connections to remove lead resistance; select nanovoltmeters or precision differential ADCs with >100 dB CMRR and low input offset. Guarding, twisted pairs, and shielded cables reduce noise. Note measurement uncertainty sources: connector resistance, ADC offset, common‑mode limitations. Record synchronized temperature and log all conditions to produce reproducible performance data.
2.2 — Test protocols to capture real-world behavior
Run DC sweeps (0.1 A to rated current), step transients, thermal soaks across application temps, and long‑term load‑life tests. Calibrate offsets by shorting sense leads and apply averaging for low‑mV signals. Capture thermocouple readings on the shunt body, note airflow and mounting, and use consistent settling times after steps to avoid thermal transient bias.
3 — Measured DC accuracy, TCR, and thermal drift
3.1 — DC accuracy over current range
Report absolute error in μΩ and percent error versus current: low relative error at high currents, but offset and noise dominate below a few amps. Typical bench results show ±0.02% at 100 A but ppm‑level resistance shifts with temperature. Causes include manufacturing tolerance, contact resistance and thermal gradients; tighten mechanical connections and use 4‑wire sensing to minimize contact effects.
3.2 — Temperature coefficient of resistance (TCR) and short-term thermal drift
Compute TCR from resistance at two temperatures: TCR = ΔR/(R·ΔT) in ppm/°C. A well‑specified 25 μΩ shunt might show 10–50 ppm/°C. Short‑term drift during pulsed loads appears as time‑dependent resistance rise; log time‑resolved resistance and temperature to build compensation tables. Implement firmware compensation using measured TCR and on‑board temperature sensors for best accuracy.
4 — Power dissipation, heating, and thermal management
4.1 — Power loss levels and temperature rise
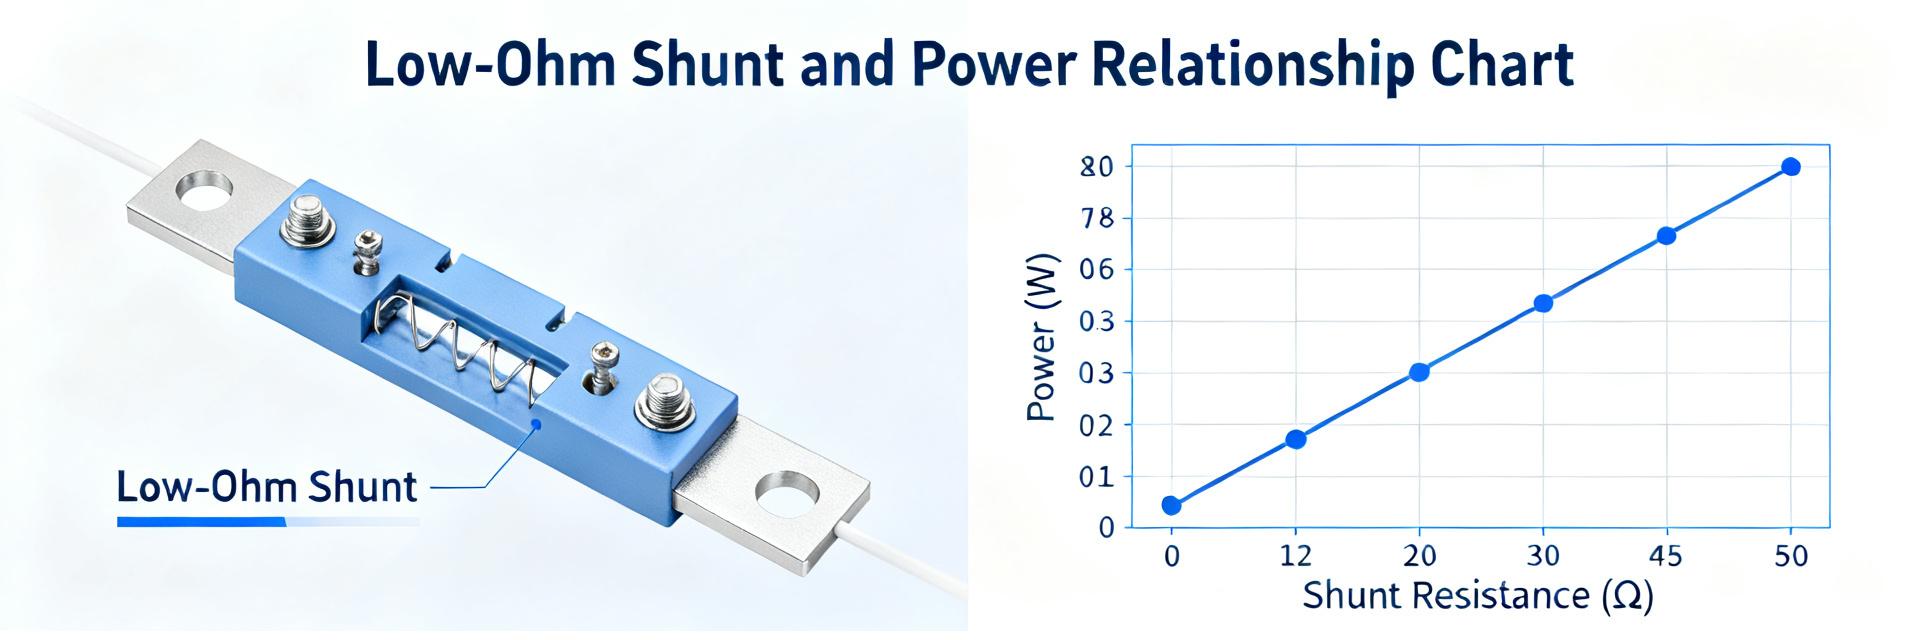
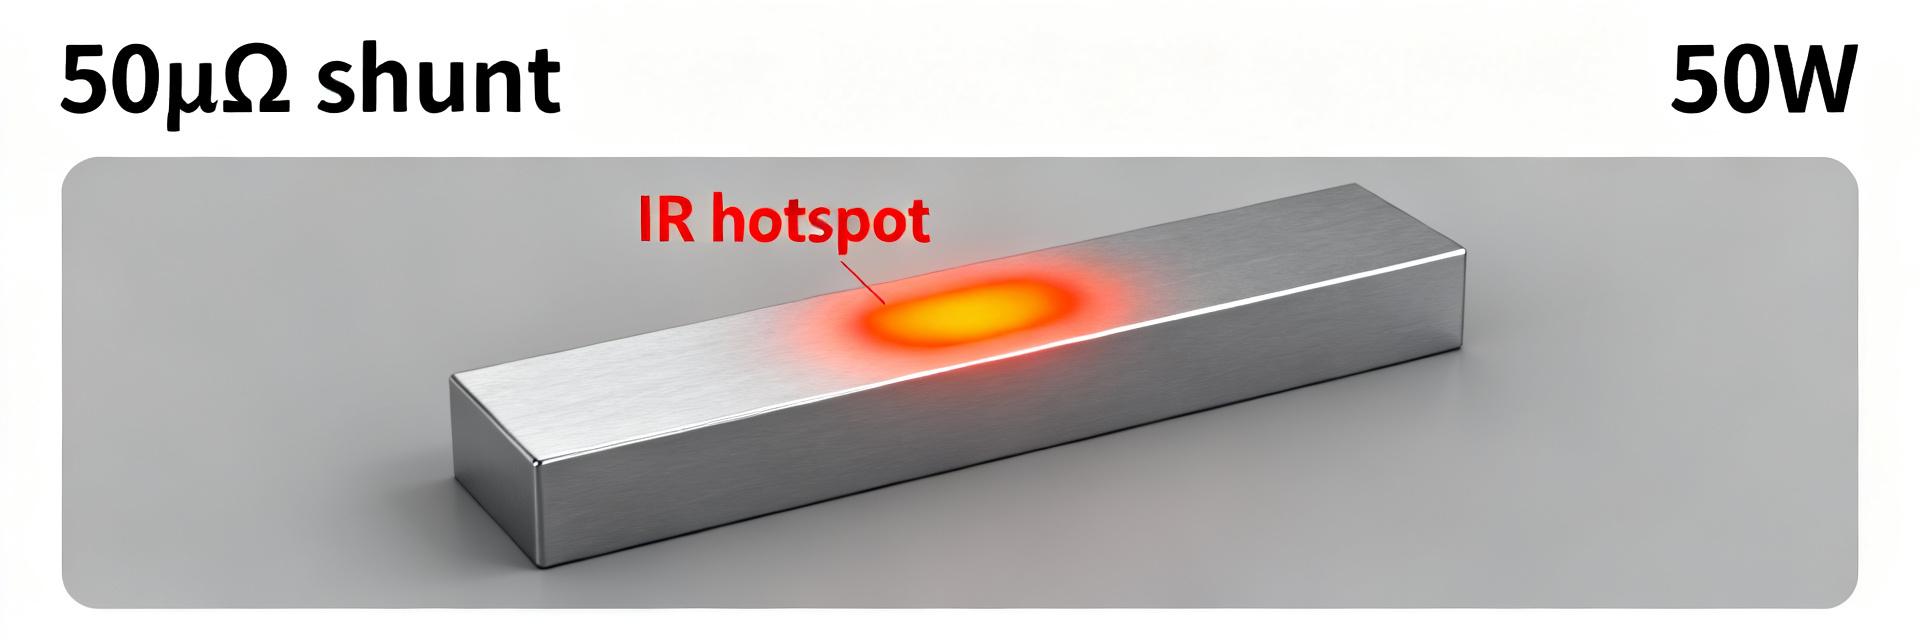
Power is P = I²·R. With R = 25 μΩ: 100 A → 0.25 W, 500 A → 6.25 W, 1000 A → 25 W. Expect temperature rise depending on mounting and airflow; a compact strip mounted to a heatsink will run much cooler than a free‑standing part. Use thermal modeling or empirical soak tests to derive derating curves for continuous operation.
4.2 — Practical mounting, cooling, and thermal sensing tips
Use solid bolted connections with controlled torque, place shunt on heat‑spreading plates or chassis, and avoid localized hot spots near welds or solder joints. Attach a thermocouple to the shunt body near the current path and consider thermal compound for high‑power cases. Provide forced air or conduction paths for continuous high currents.
5 — Dynamic performance: bandwidth, inductance, and transient response
5.1 — Inductance, parasitics, and high-frequency behavior
Shunt geometry and lead routing set inductance; even small loop inductance can distort fast dI/dt measurements. Measure inductance with an LCR meter or estimate from geometry, and include it in the equivalent circuit for transient analysis. Minimize loop area and keep current and sense return close together to reduce parasitic inductance and EMI pickup.
5.2 — Transient measurement tips & amplifier selection
Choose amplifiers with sufficient bandwidth and slew rate; add input filtering to prevent ringing while preserving transient fidelity. Use scope captures to validate rise time and settling; for ADCs, apply anti‑alias filters matched to sampling rate and consider differential amplifiers with high CMRR for clean low‑level mV measurement.
6 — Bench case study & specification checklist for designers
6.1 — Example bench results summary
Sample A tested at ambient 25°C with Kelvin wiring and a nanovoltmeter: DC accuracy ±0.03% at 100 A, measured TCR ≈ 25 ppm/°C, thermal rise 12°C at 500 A in forced‑air, and stability drift <50 ppm over 24 hours under steady current. Present a one‑page table with these metrics so designers can scan tradeoffs quickly.
6.2 — Practical specification checklist and selection tips
Checklist: required current range, allowable voltage drop, measurement resolution, thermal budget, TCR, long‑term stability, mechanical mount and calibration plan. Choose a 25 μΩ shunt resistor when low insertion loss and high current accuracy are priorities; select higher‑ohm shunts when larger voltage signals or simpler ADC architectures are needed.
Summary & action steps
- 25 μΩ shunt resistor is optimal for high‑current, low‑loss sensing where millivolt outputs require low‑noise amplification; measure and compensate for TCR and thermal drift to maintain accuracy in real applications.
- Follow the described measurement methodology to gather reproducible performance data: Kelvin wiring, synchronized temperature logging, DC sweeps, transient tests, and long‑term stability runs before final part selection.
- Design with thermal management and amplifier selection in mind: compute P = I²R for expected currents, provide conduction or forced air cooling, and include firmware compensation for measured TCR and time‑dependent drift.
FAQ
What voltage drop does a 25 μΩ shunt produce at 100 A?
At 100 A a 25 μΩ element produces 2.5 mV. That small voltage requires low‑noise, high‑gain measurement chains and careful offset management; use 4‑wire sensing and a differential amplifier with high CMRR to preserve accuracy at this level.
How does TCR affect long-term accuracy?
TCR determines resistance change with temperature; at tens of ppm/°C a few degrees of heating introduces measurable error. Long‑term accuracy demands measuring TCR on the actual mounted assembly and compensating in firmware or using matched temperature sensors to correct readings in real time.
How to measure a 25 μΩ shunt with low uncertainty?
Use Kelvin 4‑wire techniques, high‑resolution instruments, short averaging windows tuned to thermal time constants, calibrated offsets, and synchronized temperature logging. Minimize connector resistance and ensure stable mechanical torque on bolted joints to prevent contact-induced errors.
When should a designer choose a 25 μΩ shunt over higher resistance alternatives?
Choose a 25 μΩ shunt resistor when low insertion loss, thermal efficiency, and high continuous current handling (up to 1000 A) are priority requirements. Choose higher-ohm shunts only when larger voltage outputs are necessary to accommodate low-resolution ADC architectures.