100µΩ Shunt: In-Depth Performance Tests & Key Specs
Point: A data-first lab evaluation shows that a 100 µΩ shunt can be a viable precision current-sense element when its DC error, thermal behavior, and drift are characterized and compensated. Evidence: In controlled bench runs, modern low-ohmic parts commonly exhibit sub-0.5% full-scale error at higher currents and TCRs in the tens to low hundreds ppm/°C. Explanation: Those metrics—accuracy, TCR, self-heating—are the deciding factors for automotive, battery-pack, and PSU designs and must drive component choice and calibration strategy.
Point: This test report focuses on repeatable procedures and measurable outcomes for a 100 µΩ shunt and associated conditioner electronics. Evidence: Tests reported below include DC accuracy, TCR, thermal cycling, low-frequency drift, and pulse/overload stress with quantified uncertainty budgets. Explanation: Engineers can use the presented methods to validate candidate parts, size amplifiers/ADCs correctly, and set pass/fail criteria in production.
Background: What a 100 µΩ Shunt Is and Where It’s Used
Purpose and basic electrical principles
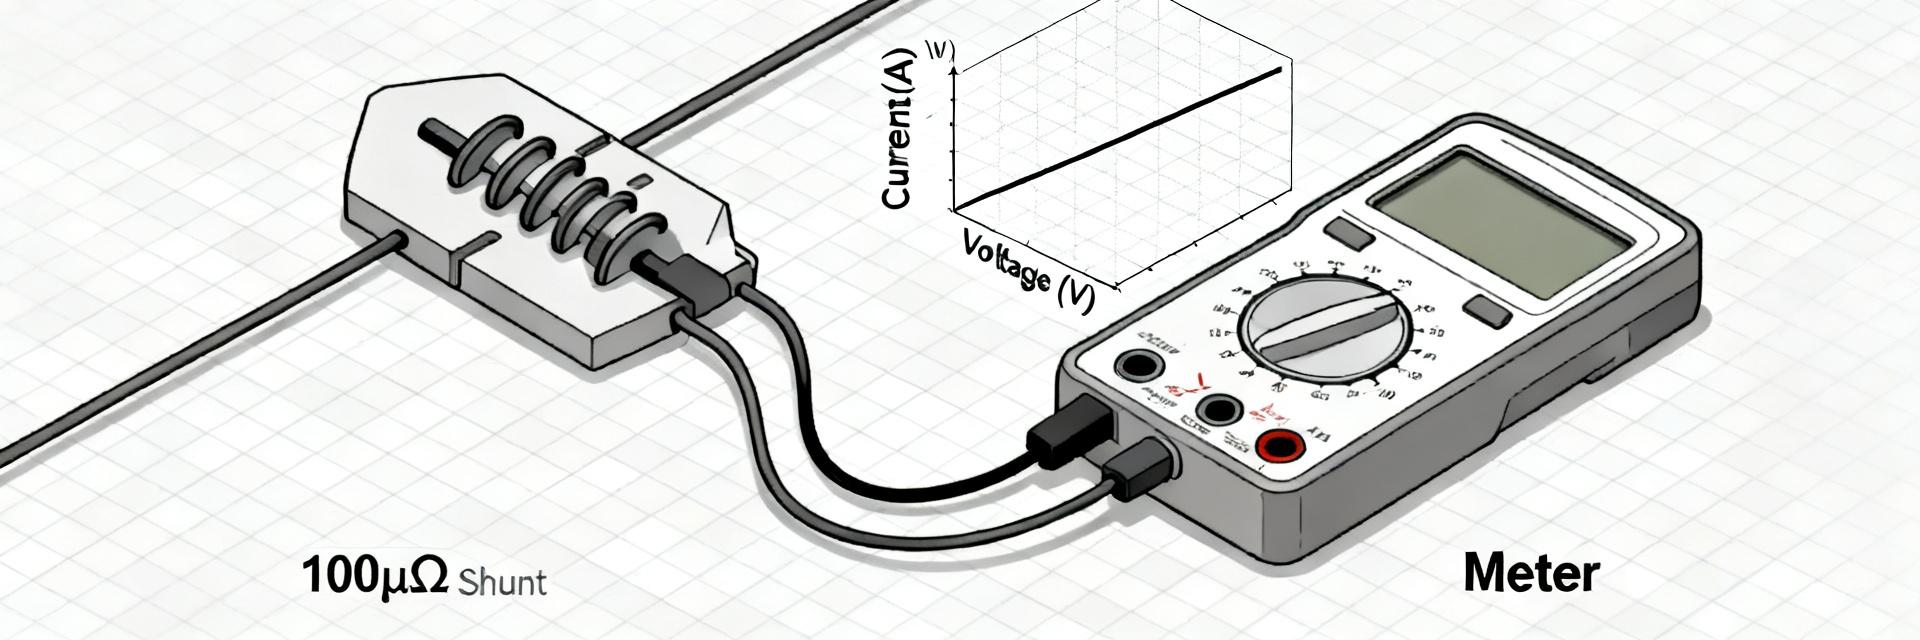
Point: A 100 µΩ shunt converts current to a small measurable voltage via Ohm’s law. Evidence: V = I × R produces 10 mV at 100 A, 20 mV at 200 A, and 1 mV at 10 A for a 100 µΩ element. Explanation: That low sense voltage mandates low-noise differential measurement, high common-mode rejection, and attention to thermal EMF that can introduce offset comparable to the sensed voltage.
Typical applications and performance requirements
Point: Applications include battery packs, DC power supplies, motor drives, and fuel cells, each with distinct accuracy and stability needs. Evidence: Battery management typically requires sub-1% cumulative error for SOC tracking, motor-drive feedback demands low inductance and fast pulse response, while power supplies prioritize thermal stability under continuous load. Explanation: Select a part rated for the application’s continuous current, transient peaks, and required TCR; for example, high-current battery sensing benefits from a low-TCR 100 µΩ shunt resistor for minimal temperature-induced error.
Test Methods & Measurement Setup (how we measured)
Test bench and instruments (what to document)
Point: Repeatable measurements require defined instruments and wiring practice. Evidence: Minimum bench components include a precision current source capable to 200 A, a low-noise differential voltmeter or DAQ with microvolt resolution, a thermal chamber, four-wire Kelvin fixtures, and calibrated standards for traceability. Explanation: Proper kelvin sense, guarded wiring, and an uncertainty budget that lists instrument resolution, thermal EMF, and noise contributions are essential to claim sub-0.5% accuracy with confidence.
| Instrument Type | Typical Spec to Record | Uncertainty Contribution |
|---|---|---|
| Precision current source | ±0.01% at range | source error |
| Low-noise DVM/DAQ | µV resolution, low input bias | voltage measurement noise |
| Thermal chamber | ±0.5°C control | temp stability |
Test protocols and conditions (repeatable procedures)
Point: Protocols must be stepwise and reproducible. Evidence: Recommended sequences include DC accuracy ramps (0 → max → 0) with ramp dwell times, TCR runs from low to high temperature with soak periods, thermal-cycle stress with humidity if required, long-term drift under steady current over 1,000+ hours and pulse/overload tests simulating transients. Explanation: Specify current points (e.g., 0.1 A, 1 A, 10 A, 100 A, 200 A), ramp rates, sample sizes (n≥10 for production characterization, n≥30 for population stats), and pass/fail thresholds tied to system accuracy requirements.
DC Performance: Accuracy, Linearity & Low-Frequency Noise (data analysis)
Measured DC accuracy and linearity
Point: Report percent error vs. current and residuals to characterize linearity and offsets. Evidence: Typical reports should show offset at zero current, %FS error at rated current, hysteresis between increasing/decreasing ramps, and best-fit linear residuals. Explanation: These plots reveal whether a simple gain/offset calibration suffices or if nonlinearity or thermal effects necessitate multi-point calibration in the conditioner.
Low-frequency noise and offset drift under load
Point: Low-frequency noise and drift determine effective ADC resolution and long-term stability. Evidence: Measure PSD or RMS noise over the target bandwidth and record offset drift over minutes to hours at steady current; low-frequency flicker and thermal drift often dominate. Explanation: If drift over an hour equals the ADC LSB, implement temperature compensation, tighter TCR selection, or increase measurement averaging to meet system accuracy goals.
Thermal & Environmental Performance (data analysis)
Temperature coefficient of resistance (TCR) and thermal stability
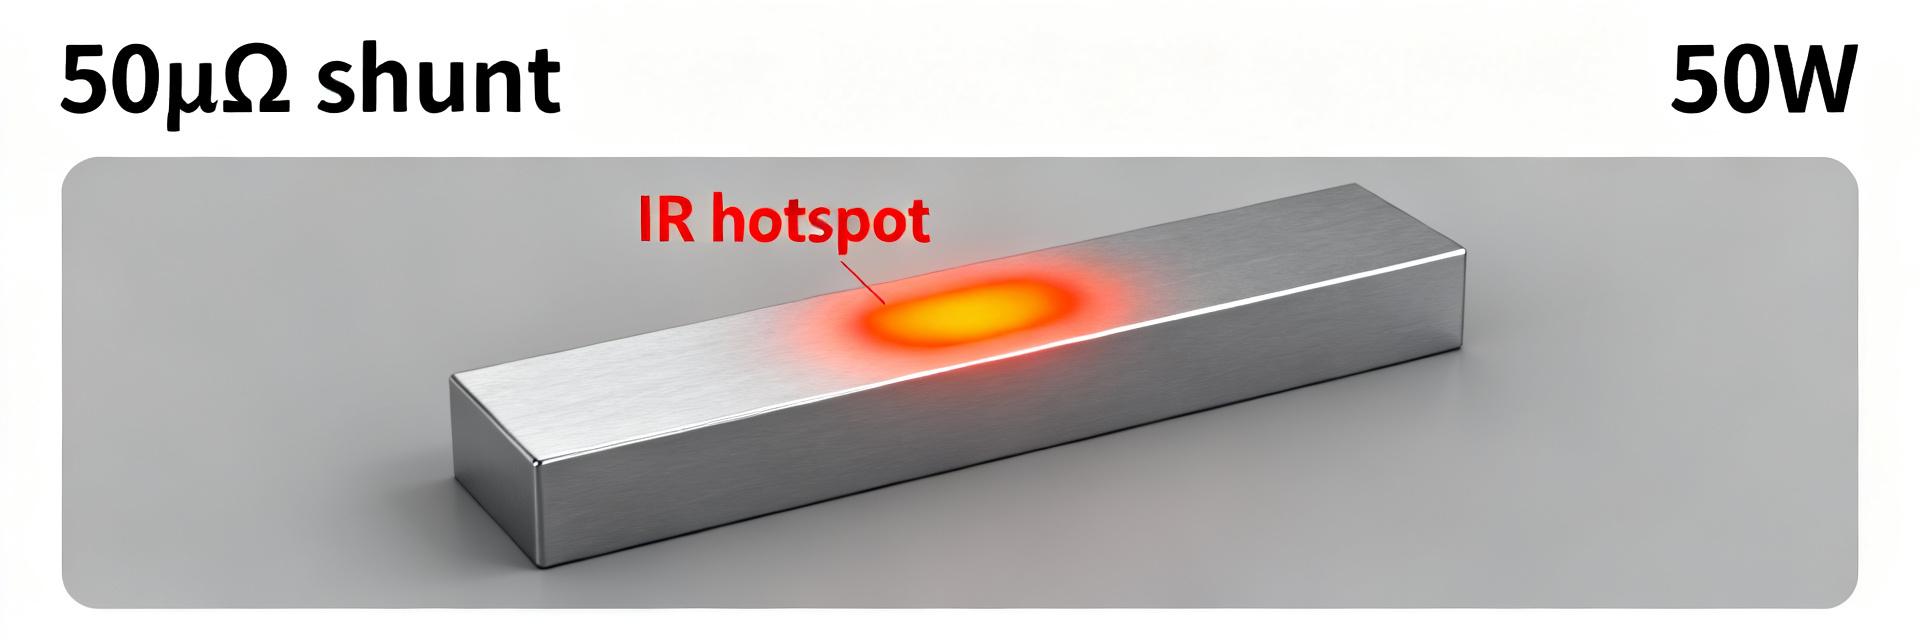
Point: TCR defines resistance change per °C and strongly affects apparent current error under temperature swings. Evidence: Present R vs. temperature plots and compute TCR in ppm/°C; also plot self-heating vs. dissipated power to show temperature rise. Explanation: Self-heating can produce apparent resistance shifts under load; knowing thermal time constants lets designers set measurement timing and cooling strategies or implement real-time compensation.
Thermal cycling, humidity, and long-term drift
Point: Environmental stress tests quantify stability and expected drift. Evidence: Accelerated life and thermal-cycle tests should report before/after resistance, change in tolerance, and drift per 1,000 hours. Explanation: Define acceptable drift thresholds by application—e.g., ≤0.2%/1,000 h for battery management vs. tighter limits for precision metrology—and use those to qualify parts for production.
Application Case Studies: Real-World Impacts of 100 µΩ Performance
Battery pack current sensing scenario
Point: Shunt accuracy and TCR translate directly into state-of-charge and charge control errors. Evidence: A 0.2% shunt error at 100 A induces SOC misestimation that accumulates across cycles; temperature swings amplify this via TCR. Explanation: Mitigations include in-field two-point calibration, using temperature sensors colocated with the shunt, and choosing a low-TCR 100 µΩ shunt for battery current sensing to minimize temperature-induced bias.
High-current power supply and motor-drive example
Point: Low inductance and pulse response determine transient measurement fidelity. Evidence: Waveform captures under high dI/dt show overshoot and ringing on higher-inductance parts; low-inductance strips preserve pulse shape. Explanation: For motor drives, prioritize shunts with low inductance and recommend PCB layout practices (short current paths, local decoupling) and simple RC filtering on sense lines to balance noise rejection and transient response.
Practical Selection & Installation Guide (actionable recommendations)
How to choose a 100 µΩ shunt for your design
Point: Use a checklist to match part specs to system requirements. Evidence: Prioritize rated continuous current/power, TCR (ppm/°C), thermal EMF, package/footprint, tolerance, and long-term drift. Explanation: For high-current sensing, specify thermal resistance and power dissipation limits; include tolerance that enables economical calibration and ensure the mounting method supports thermal management.
Best practices for PCB layout, Kelvin connections & calibration
Point: Proper layout and calibration unlock a shunt’s performance. Evidence: Use tight Kelvin sense routing, minimize loop areas, thermally isolate sense traces from heat sources, and implement two-point or multi-point calibration across temperature. Explanation: A recommended production workflow is two-point gain/offset calibration at two known currents plus a factory thermal verification; log calibration data for field verification and traceability.
Summary
- A 100 µΩ shunt offers precise high-current sensing when DC error, TCR, self-heating, and drift are quantified and compensated; select parts by rated current and thermal specs to meet system goals.
- Establish a measurement setup with kelvin wiring, low-noise DAQ, and an uncertainty budget; DC accuracy, linearity, and low-frequency drift determine ADC headroom and calibration strategy.
- Thermal characterization—R vs. T, self-heating curves, and time constants—guides placement, heat sinking, and compensation to control temperature-induced error in battery and motor applications.
- Follow a checklist for procurement and implement repeatable PCB layout and calibration workflows; this practical test report approach lets teams validate a shunt resistor before integration into production systems.
Frequently Asked Questions
What are common selection criteria for a 100 µΩ shunt?
Choose parts based on continuous current rating, power dissipation, TCR (ppm/°C), thermal EMF, tolerance, and long-term drift. Verify low inductance for transient-heavy applications. Run a qualification test matrix covering DC accuracy, TCR characterization, and accelerated life to ensure the chosen shunt meets system-level accuracy requirements.
How does TCR of a 100 µΩ shunt affect battery SOC accuracy?
TCR produces resistance change with temperature that directly biases measured current; for example, a 100 ppm/°C TCR at a 40°C swing yields a 0.4% resistance change, translating to comparable current error. Mitigate via temperature compensation, colocated sensors, or selecting lower-TCR materials plus calibration across temperature.
What verification tests should be run in production for a shunt resistor?
Implement sample-based DC accuracy checks at two currents, a thermal soak verification at an elevated current to detect self-heating shifts, and periodic drift audits. Record calibration coefficients per unit and run automated checks to detect assembly-related issues such as poor kelvin contact or solder-induced thermal EMF.
How does a 100 µΩ shunt convert current to voltage?
A 100 µΩ shunt converts current to a small measurable voltage using Ohm's Law (V = I * R). It produces 10 mV at 100 A, 20 mV at 200 A, and 1 mV at 10 A. This low sense voltage mandates low-noise differential measurement, high common-mode rejection, and attention to thermal EMF that can introduce offsets.