HoFL3-8518-A 100uR shunt resistor: Precision Data Deep Dive
As precision current sensing pushes into higher currents and tighter accuracy budgets, component-level metrics matter more than ever; this brief examines how to turn datasheet numbers into repeatable design and test decisions for US engineering teams, using the HoFL3-8518-A as the focal example. The discussion highlights which fields to extract, how to bench-test performance, and how to integrate millivolt-level sensing into robust systems.
1 — Why 100 µΩ shunts matter (Background)
1.1 — Role in precision current sensing
Point: Ultra-low-value shunts at the 100 µΩ order enable high-current measurement with minimal insertion loss. Evidence: datasheet-class descriptions consistently show millivolt-level drops at hundreds of amps, making them common in BMS, EV power electronics, and lab equipment. Explanation: Designers choose 100 µΩ when they need sub-0.1% system loss but must amplify millivolt signals while controlling Vdrop and self-heating effects.
1.2 — Key electrical/thermal trade-offs to watch
Point: Selecting a 100 µΩ part is a trade between measurable sense voltage and thermal influence on resistance. Evidence: key datasheet fields—tolerance, TCR, power rating, and thermal impedance—drive error budgets. Explanation: lower resistance reduces insertion loss but increases sensitivity to TCR and power density; prioritize specs according to whether the application values steady-state accuracy, transient response, or temperature stability.
2 — Datasheet deep-dive: electrical & thermal specs of HoFL3-8518-A
2.1 — Must-extract datasheet fields (table spec)
Point: Capture a consistent set of fields into your internal spec table for direct comparison and modeling. Evidence: extract nominal resistance (µΩ), tolerance (%), TCR (ppm/°C), rated power (W), thermal impedance or derating curve, operating range, mechanical dims, and solder/weld recommendations directly from the datasheet. Explanation: this dataset feeds simulation, thermal budgeting, and procurement documents; ensure units are normalized (µΩ, ppm/°C, W) and flags noted for any ambiguous entries.
| Parameter | Target Value (HoFL3-8518-A) | Design Relevance & Engineering Actions |
|---|---|---|
| Nominal Resistance | 100 µΩ | Establishes base V_SENSE of 100 mV per 1000 Amps. |
| Standard Tolerance | ±1.0% (±5.0% options) | Sets the end-of-line calibration targets for gain error. |
| Temperature Coefficient (TCR) | ±50 ppm/°C (typical) | Drives active thermal drift compensation models in software. |
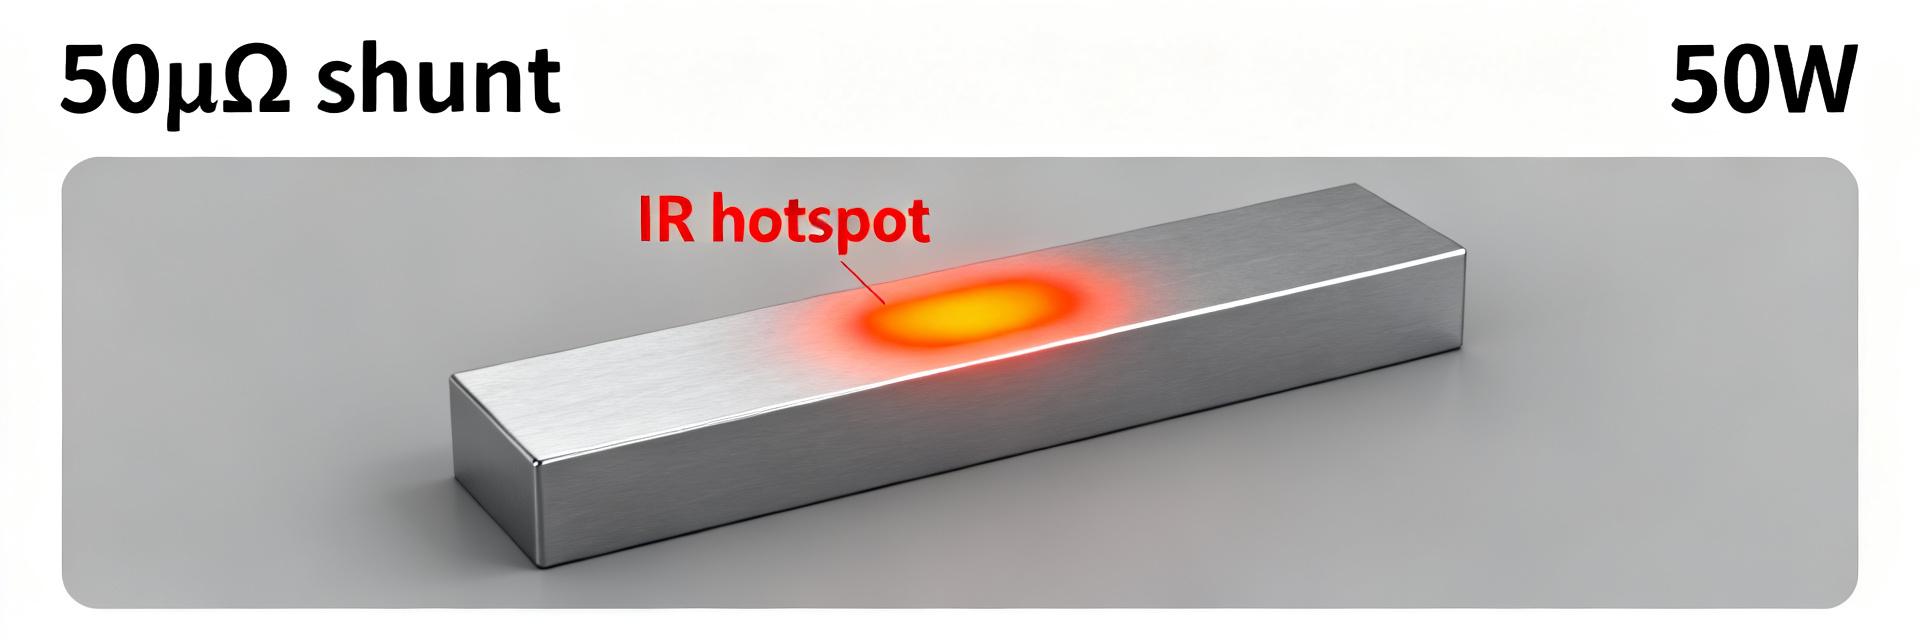
| Continuous Power Rating | 36 W (maximum) | Sets the structural physical current limit under passive air. |
| Operating Range | -65°C to +170°C | Supports extreme automotive and harsh industrial profiles. |
2.2 — Interpreting thermal derating & power handling
Point: Thermal derating curves translate electrical power into allowable continuous current at an ambient temperature. Evidence: a typical derating curve shows rated power at 25°C and reduction to zero at Tmax; thermal impedance links power to temperature rise. Explanation: use P = I^2·R to compute steady power, then ΔT = P·θJA (thermal impedance) to estimate case rise and consult derating to confirm continuous Imax at target ambient.
3 — Performance benchmarking: test methods and expected metrics for HoFL3-8518-A 100uR shunt resistor
3.1 — Recommended lab test setups & measurement techniques
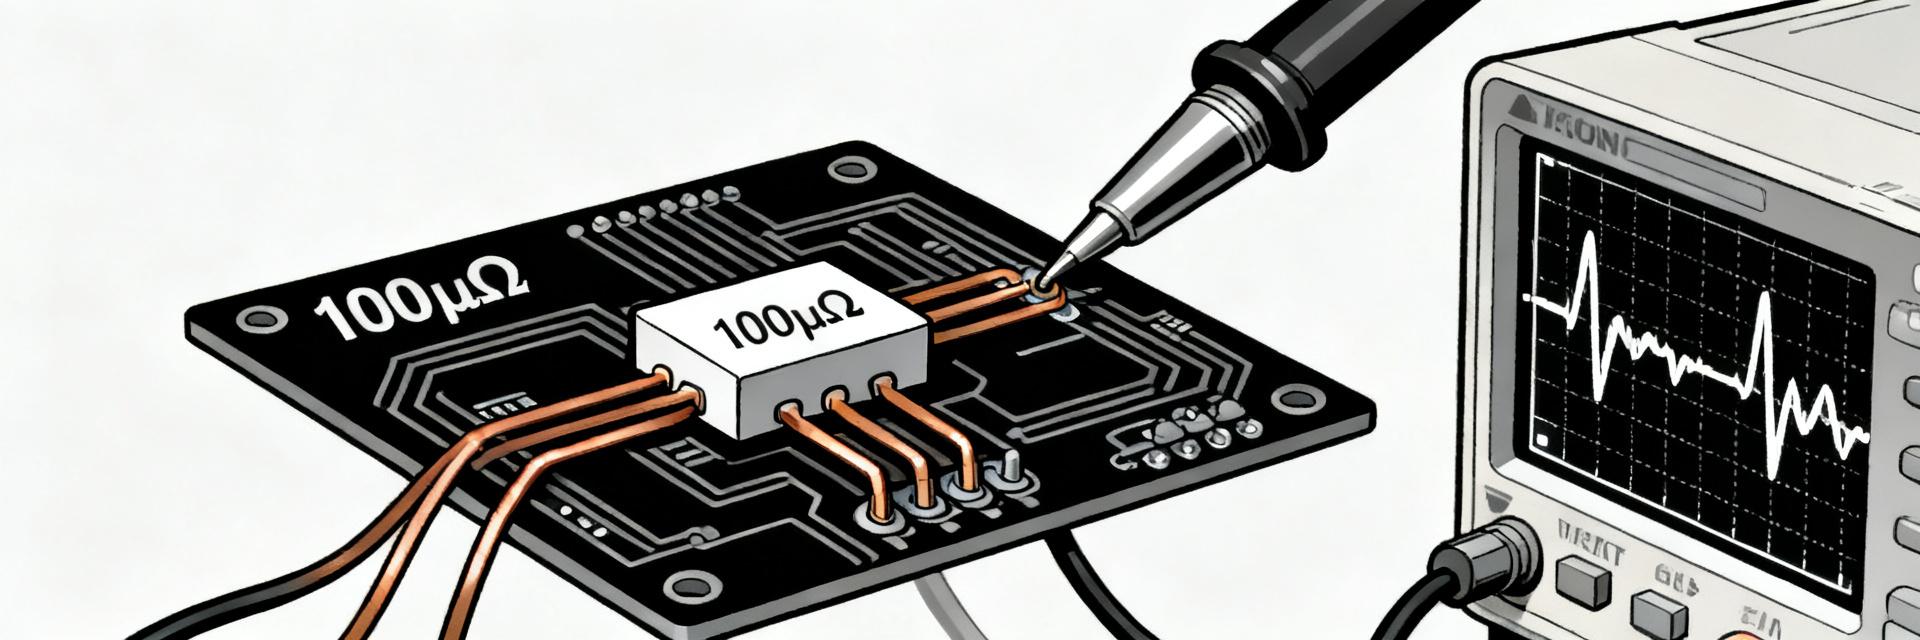
Point: Accurate characterization requires low-noise, four-wire measurement and controlled thermal conditions. Evidence: best-practice plans include Kelvin wiring, low-EMF connectors, precision current sources, and a temperature chamber for T sweeps. Explanation: run DC R vs T, IV linearity, and transient loading tests; average multiple readings to reduce noise and document fixturing to ensure repeatability in qualification reports.
3.2 — Key performance metrics to capture and how to present them
Point: Record DC resistance vs temperature, TCR curve, linearity, thermal transient, LF noise, and stability over cycles. Evidence: datasheet typically quotes static R, tolerance, and TCR; full characterization fills gaps for system error budget. Explanation: present IV plots, resistance vs T with ± tolerance bands, step-response thermal graphs, and noise spectra; use ppm/°C and ppm referencing to nominal R for clarity.
4 — Integration and PCB / system design guidelines (Method)
4.1 — PCB layout and mechanical integration
Point: Preserve the millivolt sense by separating force and sense paths and managing heat conduction. Evidence: layout guidance emphasizes Kelvin-sense routing, generous copper for heat spreading, and thermal vias beneath pads. Explanation: route high-current traces with wide pours, place sense traces to shortest path to amplifier inputs, and follow recommended solder/weld profiles to avoid mechanical stress or altered resistance.
4.2 — Signal conditioning & amplifier selection for millivolt sensing
Point: Amplifier choice drives final accuracy; key specs include input offset, noise, CMRR, and input bias. Evidence: for a 100 µΩ shunt, full-scale millivolt outputs require gains that keep amplifier errors below system budget. Explanation: target amplifier offset and noise that produce errors <25% of total allowed error; implement RC anti-aliasing and consider instrumentation amps or difference amplifiers with appropriate common-mode range.
5 — Comparative selection matrix & application-driven recommendations (Case)
5.1 — How to compare 100µΩ shunts: matrix fields
Point: Use a weighted comparison matrix to map device trade-offs to application needs. Evidence: matrix columns should include R, tolerance, TCR, power, package, thermal impedance, price, lead time, and target application. Explanation: assign weights per application (e.g., EV: TCR and power high weight; lab instrument: stability and tolerance high weight) and score candidates for side-by-side decisioning.
5.2 — Example application recommendations
Point: Different use cases prioritize different specs. Evidence: BMS and EV prioritize low TCR and high power rating; lab instruments prioritize low tolerance and stability. Explanation: recommend shunts with tight TCR and robust thermal derating for EV; for bench metrology prefer tight tolerance and traceable characterization procedures to minimize calibration drift.
6 — Sourcing, qualification, and production test checklist (Action)
6.1 — Datasheet red flags, procurement checklist, and traceability
Point: Vet datasheets for clarity and traceability before procurement. Evidence: common red flags include ambiguous TCR units, missing derating data, or absent lot traceability statements in the datasheet. Explanation: require lot traceability, RoHS/REACH declarations, batch test reports, and an agreed qualification flow that includes sample characterization against the published datasheet claims.
6.2 — Incoming inspection & production test plan
Point: Define a minimal incoming and production test set to prevent field escapes. Evidence: a pragmatic plan includes batch DC resistance sampling, visual, temperature cycling, and first-article thermal verification. Explanation: set AQL-style sample sizes, define pass/fail bands tied to tolerance and TCR expectations, and reserve destructive tests on representative samples for long-term reliability metrics.
Summary
Actionable takeaways: extract the critical fields from the HoFL3-8518-A datasheet, validate TCR and thermal derating with targeted lab tests, design PCB and amplifier chains to preserve millivolt signals, and enforce a strict sourcing and qualification checklist before production. These steps convert datasheet claims into validated system-level performance and mitigate thermal and measurement risks.
- Extract and normalize datasheet fields (R in µΩ, tolerance, TCR in ppm/°C, power W, thermal impedance) to feed simulations and procurement checks; this ensures consistent comparison.
- Verify thermal derating with P = I²R and thermal-impedance ΔT estimates plus chamber tests to determine continuous allowable current under your ambient conditions.
- Use four-wire Kelvin measurement, low-noise sources, and temperature sweeps to produce DC R vs T, linearity, and noise data for system error budgets.
Frequently Asked Questions
What is the expected accuracy impact of TCR for a 100uR shunt?
TCR converts temperature change into resistance change and can dominate error at high currents. A TCR of several ppm/°C on a 100 µΩ part yields micro-ohm shifts that translate to ppm-level measurement error. Quantify system-level impact by multiplying TCR (ppm/°C) by anticipated temperature rise (ΔT) and include that term in the overall error budget alongside amplifier error and tolerance.
How should I set up a reliable HoFL3-8518-A 100uR shunt resistor test?
A reliable test minimizes parasitics and controls temperature. Use four-wire Kelvin wiring, low-EMF connectors, a precision current source, and a temperature chamber for sweeps. Run steady-state and transient current profiles, average repeated readings to reduce noise, and document fixture geometry so results are reproducible for qualification and supplier dialogue.
What datasheet items are deal-breakers when sourcing 100uR shunts?
Some missing or inconsistent datasheet items should halt procurement. Absent TCR, unclear derating, or no lot traceability are common red flags. Require explicit TCR units, a derating curve with a clear temperature axis, and supplier batch test reports; without these, you cannot reliably model or guarantee in-system accuracy.
How does PCB layout affect the measurement of a 100uR shunt?
At 100 µΩ, trace parasitics can easily dwarf the shunt resistance. Separate force and sense paths strictly using Kelvin connections directly on the internal sensing pad edges, route differential sense traces close together, and use generous copper pours with thermal vias to mitigate localized hot spots.