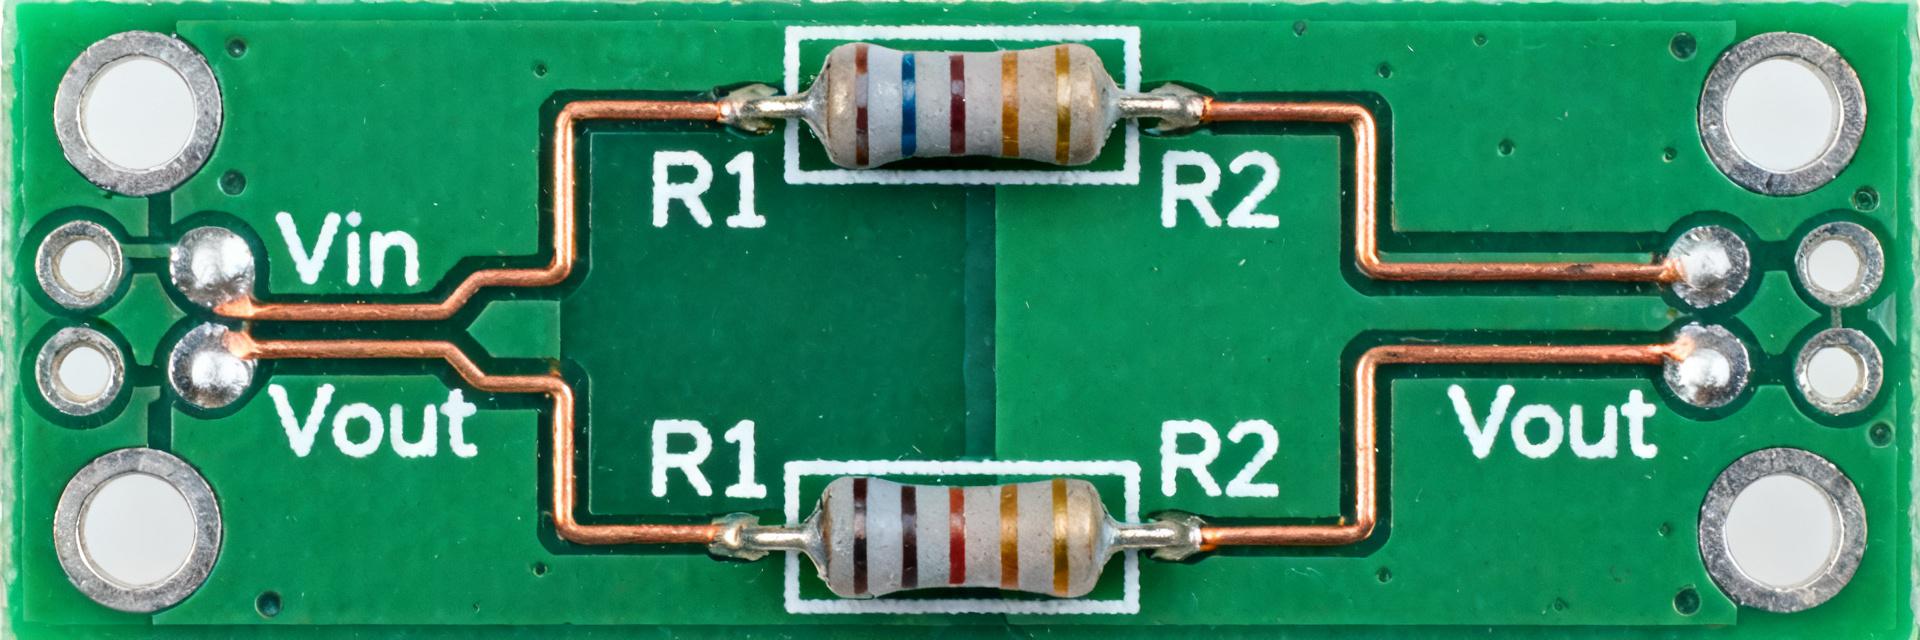
HPCR 0819 datasheet: Performance Data & Thermal Limits
Measured peak power-handling and derating curves show that the HPCR 0819 can sustain short pulses at several times its nominal steady-state rating — critical for power-limited PCB designs. The HPCR 0819 appears across snubber networks and surge applications where axial ceramic construction and pulse endurance matter. This article interprets the HPCR 0819 datasheet, extracts key performance numbers, explains thermal limits, and provides practical guidance for design, testing, and validation.
Readers will get spec highlights, thermal behavior interpretation, test methods to reproduce datasheet curves, PCB/mount guidance, and an engineer checklist for BOM and production validation. References to the datasheet and thermal limits are used to ground calculations and suggested margins for safe operation.
1 — Product background & when to choose HPCR 0819 (Background introduction)
1.1 — Typical use cases and form factor
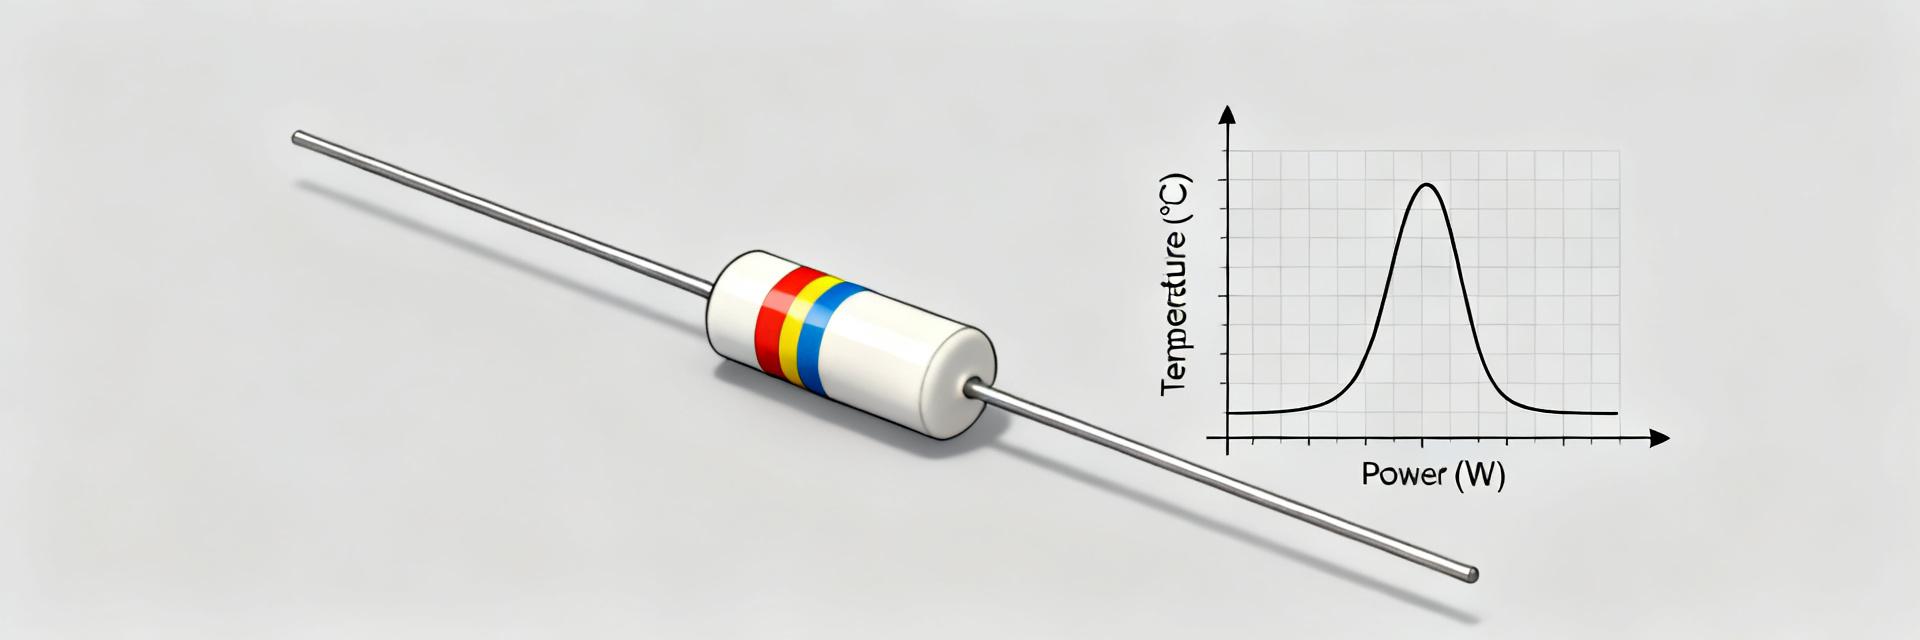
Point: The HPCR 0819 is an axial/lead ceramic resistor used where compact power dissipation and pulse tolerance are required. Evidence: The part’s axial lead and compact 0819 footprint put it in the same mechanical class used for snubbers, surge resistors and power-distribution drop elements. Explanation: In practice you choose this form when a leaded device eases assembly, allows through-hole mounting for higher mechanical fatigue tolerance, and when ceramic construction provides stable resistance under thermal shock compared with polymer or wirewound alternatives.
1.2 — Key specs snapshot (quick reference)
Point: A compact spec table lets you compare rated power, resistance range and thermal metrics at a glance. Evidence: The datasheet lists rated power, resistance options, tolerance, temperature coefficient, and peak voltage/current limits. Explanation: Use the table to pre-qualify parts for BOM selection and to ensure footprint and derating expectations align with your thermal budget.
| Parameter | Example Value (per datasheet) |
|---|---|
| Rated power (steady-state) | 0.5 W (device class example) |
| Resistance range | 0.1 Ω – 1 MΩ (select ranges) |
| Tolerance | ±1% / ±5% |
| Temp coefficient | ±50 ppm/°C (typical) |
| Peak voltage / current | Specified pulse ratings in datasheet |
| Size / footprint | Axial 0819 form, leaded length ~12–20 mm |
2 — HPCR 0819: Electrical performance from the datasheet (Data analysis)
2.1 — DC resistance characteristics and tolerances
Point: Nominal resistance and tolerance directly affect design margin and matching. Evidence: Datasheet values show discrete nominal resistances and defined tolerance classes; temperature coefficient data indicates drift per °C. Explanation: When you specify parts in the BOM, quote nominal value, tolerance, and the temperature-coefficient class to guarantee matching. For precision networks allow extra margin for worst-case drift across expected ambient swing.
2.2 — Power rating vs pulse capability (short-pulse performance)
Point: Steady-state power rating differs from pulse capability; pulse handling is defined by thermal impedance curves in the datasheet. Evidence: The datasheet provides Zθ(t) or pulse/energy curves; use those curves to predict temperature rise from a known pulse profile. Explanation & example: compute transient ΔT using ΔT = Ppulse × Zθ(t). Example: for a 5 W pulse of 100 ms and a Zθ(100 ms) of 2 °C/W, ΔT ≈ 10 °C. Compare this to allowed body/junction rise from the datasheet to confirm safe pulses.
3 — Thermal limits & derating curves explained (Data analysis — thermal limits)
3.1 — Thermal resistance, ambient derating and maximum junction/body temps
Point: Thermal resistance metrics and the ambient derating curve tell you how rated power reduces with temperature. Evidence: The datasheet identifies thermal resistance (°C/W) and a derating plot (rated power vs ambient). Explanation: Read the curve by locating 25 °C rated power, noting the derating start temperature, and interpolating power allowance at your operating ambient. For ceramic axial resistors treat body temperature as the practical limit; specify a conservative margin (e.g., 10–20% below absolute rated power) to compensate for PCB coupling.
3.2 — Safe operating area and transient temperature limits
Point: Absolute maximums include short-term surge and repetitive pulse constraints; operating below these ensures longevity. Evidence: Datasheet pulse tables list single-pulse and repetitive-pulse limits and recommended derating. Explanation & example: define a safe operating area by choosing a working power limit (for example 70% of absolute) and validating a sample pulse: if a 200 ms pulse yields ΔT close to the body max, reduce amplitude or increase spacing. Recommend 20–30% safety margin for repetitive pulses in production designs.
4 — How to test and validate HPCR 0819 thermal behavior in your lab (Method/guide)
4.1 — Recommended test setups and measurement points
Point: Reproduce datasheet conditions with a controlled fixture and measured temperatures. Evidence: Use a rig with calibrated thermocouples attached to the resistor body, an ambient sensor, and a programmable pulse source to match pulse widths and duty cycles. Explanation: Mount the resistor on a representative PCB section, secure thermocouple to the body with thermally conductive adhesive, and log both body and ambient temps. For IR use, cross-check with contact thermocouple to avoid emissivity errors.
4.2 — Data logging, curve extraction and reporting format
Point: Capture steady-state and transient data to extract thermal impedance and derating behavior. Evidence: Record voltage, current, power, body temp, and ambient at sufficient sample rate to resolve pulses. Explanation: Plot temperature vs time and power vs temperature; compute Zθ(t) = ΔT / Ppulse for different pulse durations. Report graphs with clear axes, test conditions, and pass/fail against datasheet curves; include uncertainty bounds from sensors.
5 — PCB layout, mounting and reliability considerations (Method/Case)
5.1 — Mounting, spacing and thermal coupling best practices
Point: PCB copper area, lead length and proximity to thermal masses control dissipation. Evidence: Longer leads and larger copper planes increase heat spreading, altering effective thermal resistance. Explanation: Keep lead lengths consistent with datasheet test conditions or characterize the specific assembly. Use thermal vias or copper pour under anchor points for improved dissipation, and avoid placing heat-sensitive ICs adjacent to high-energy resistors without thermal isolation.
5.2 — Environmental and reliability factors to watch
Point: Coatings, vibration, and contaminants change long-term thermal and mechanical behavior. Evidence: Conformal coatings and immersion fluids alter convective cooling; axial leads are susceptible to fatigue under vibration. Explanation: For high-energy or harsh environments specify suitable coating materials, perform mechanical bend tests for leads, and establish inspection cycles. For critical systems adopt periodic thermal verification after defined service hours or events.
6 — Practical checklist & design action items (Action recommendations)
6.1 — Pre-selection checklist
- Verify exact resistance and tolerance class against system accuracy requirements.
- Confirm rated power at intended ambient from the datasheet and apply derating.
- Confirm pulse capability and compare required pulse energy to datasheet pulse curves.
- Plan mounting: lead length, PCB copper area, and thermal vias to match test conditions.
- Document test validation plan and required instrumentation before purchase.
6.2 — In-production monitoring and derating policy
- Apply a production derating rule (e.g., operate at ≤70% rated power at your max ambient).
- Log pulse events, peak temps, and time-on-power for field failures to analyze trends.
- Include periodic thermal performance checks for high-energy circuits (sample-based).
Summary
Restatement: To apply the HPCR 0819 datasheet effectively, you must distinguish steady-state rating from pulse capability, interpret Zθ(t) or derating curves, and validate the assembly with representative lab tests. The datasheet supplies thermal limits and pulse curves that you must reproduce on your PCB to guarantee reliability. Validate through contact thermometry and conservative derating to protect against repetitive surge damage.
- Understand rated power vs pulse: use datasheet pulse curves to compute ΔT = Ppulse × Zθ(t) and verify body/junction limits for HPCR 0819 before BOM sign-off.
- Design PCB thermal coupling: match lead length and copper area to datasheet conditions and include thermal vias; this reduces effective thermal limits and supports datasheet-rated performance.
- Test and report: capture steady-state and transient temperature, extract Zθ(t), and compare to datasheet thermal limits with a defined pass/fail criterion for production validation.
7 — Common questions and answers
1 — What is the steady-state power rating for HPCR 0819 and how should I derate it?
Answer: The datasheet specifies the nominal steady-state power at 25 °C; derate according to the provided ambient curve. A safe rule is to operate at 60–80% of rated power at elevated ambient temperatures. Confirm the exact rated value from the datasheet for your part number, then apply chosen derating policy in the BOM and production tests.
2 — How do I verify HPCR 0819 pulse capability in my lab?
Answer: Replicate datasheet pulse conditions using a programmable pulse source, mount the resistor on a representative PCB, and measure body temperature with a contact thermocouple. Capture voltage/current and temperature vs time, compute Zθ(t) = ΔT / Ppulse, and compare your curves to the datasheet. Report results with uncertainty and pass/fail limits.
3 — Which thermal limits matter most when specifying HPCR 0819 for surge applications?
Answer: Prioritize maximum allowable body/junction temperature, repetitive-pulse energy limits, and the derating curve. Ensure your transient ΔT plus steady-state rise stays below the datasheet absolute max with margin. Also consider environmental factors—coating, PCB copper, and mechanical stress—that can reduce effective thermal performance over time.
4 — How does PCB layout affect the thermal dissipation and limits of the HPCR 0819?
Answer: PCB copper area, lead length, and thermal vias directly determine the system-level thermal resistance. Shorter lead lengths reduce the thermal path to the PCB ground/power planes, turning the circuit board into an active heatsink. Using thermal vias under mounting pads maximizes power handling and helps maintain the device well below its maximum body temperature limits.