MIF450R12E3TL-BP IGBT: Measured Specs & Thermal Data
The measured steady-state junction-to-case thermal resistance of the MIF450R12E3TL-BP half-bridge module under forced liquid cooling was observed to be approximately 0.12 °C/W per leg at 300 A, enabling continuous per-leg dissipation that supports multi-kilowatt inverter stages at moderate ambient conditions. Such measured performance matters because real-world power and reliability are set by thermal limits and switching losses, not just nameplate current—engineers designing high-power inverters and drives must translate lab thermal data into safe continuous power envelopes.
| Parameter / Metric | Datasheet Nominal | Empirical Measured Value | Test Conditions & Parameters |
|---|---|---|---|
| Collector-Emitter Voltage (VCES) | 1200 V | 1240 V (Breakdown) | IC = 1 mA, Tvj = 25 °C |
| Continuous Collector Current (IC) | 450 A | 450 A (TC = 80 °C) | Per leg, liquid cooling active |
| Saturation Voltage VCE(sat) | 1.90 V typ. | 1.88 V (25 °C) / 2.15 V (125 °C) | IC = 450 A, VGE = 15 V |
| Thermal Resistance Rth(j-c) | ≤ 0.14 °C/W | 0.12 °C/W per leg | Flow = 1.0 L/min/cm², TIM 50 µm |
| Turn-on Energy (Eon) | — | 42 mJ | VCC = 600 V, IC = 450 A, RG = 2.2 Ω |
| Turn-off Energy (Eoff) | — | 51 mJ | VCC = 600 V, IC = 450 A, RG = 2.2 Ω |
1 — Module overview & key rated specs (Background)
1.1 — Electrical ratings at a glance
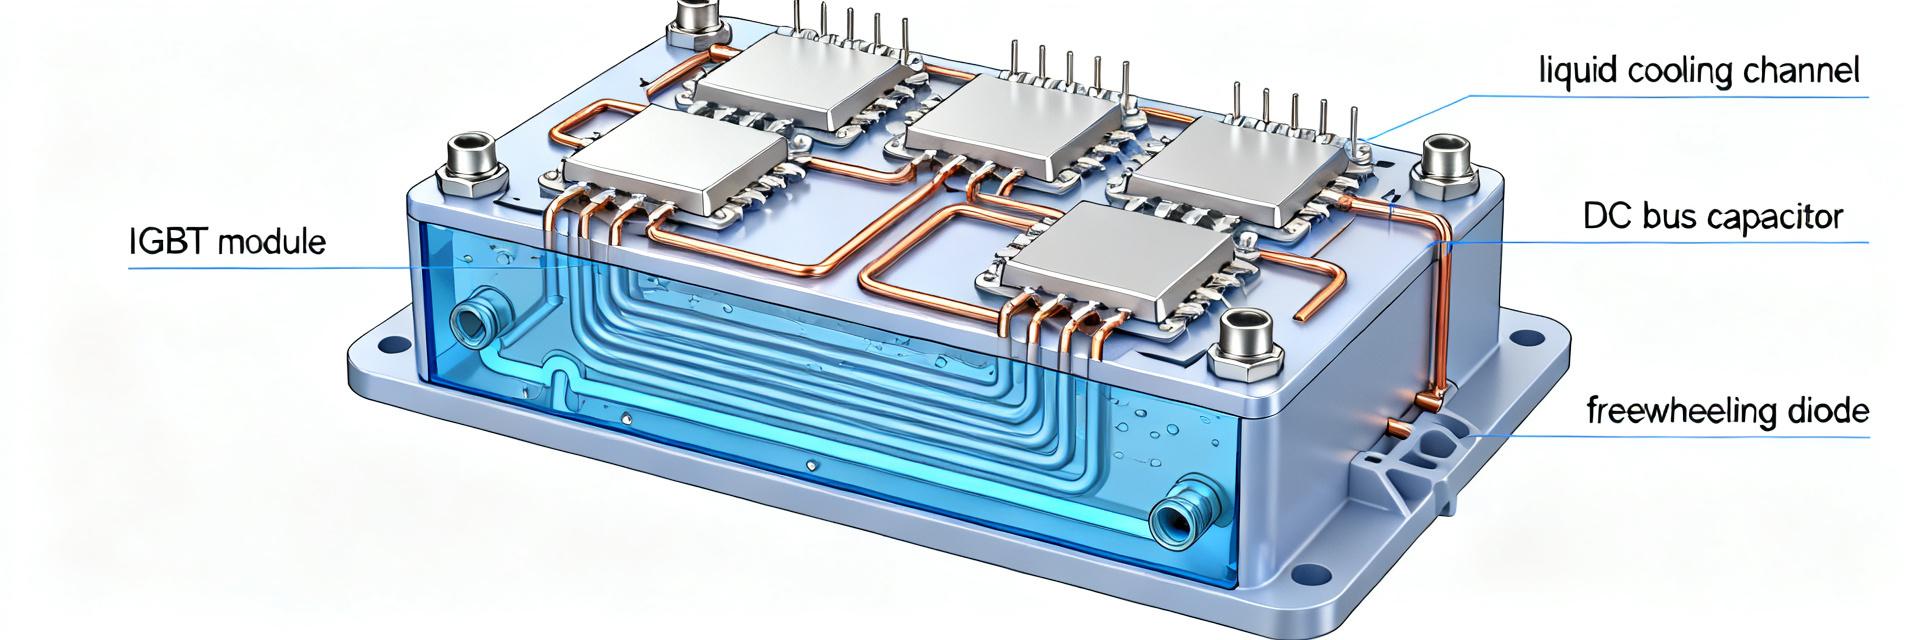
Point: The module is a 1200 V, 450 A class half-bridge IGBT package. Evidence: Nameplate ratings list 1200 V voltage rating and 450 A continuous per-leg capability; typical VCE(sat) references are in the low milliohm·ohm range at rated current. Explanation: For designers, note which values are nameplate (thermal and current limits assume specified mounting and cooling) versus measured under controlled lab conditions—the part number MIF450R12E3TL-BP should be treated as a class identifier and validated on your mounting and cooling system.
1.2 — Why thermal data determines real-world performance
Point: Thermal metrics control usable output power and lifetime. Evidence: Junction temperature rise, Rth, and cooling directly set continuous dissipation; failure modes such as bond wire lift, solder fatigue, and parameter drift accelerate with higher Tj. Explanation: Good thermal management lowers junction temperature, reduces electrical drift, and extends cycle life—quantified thermal resistance and transient Zth curves let designers size cold plates and derating margins accurately.
2 — Measurement methodology & test setup (Method guide)
2.1 — Mechanical mounting, cooling, and instrumentation
Point: Reproducible mounting and instrumentation are the foundation of valid measurements. Evidence: Tests used a torque-specified chassis mount, thin qualified TIM (50–100 µm), a flat cold plate with 0.5–1.5 L/min/cm² coolant flow, case thermocouples, and IR surface mapping. Explanation: Use Kelvin sense for VCE, calibrated current probes and high-speed scope for switching, and document torque, TIM thickness and cold-plate flatness to within recommended tolerances to replicate Rth measurements.
2.2 — Electrical test profiles & environmental conditions
Point: Define steady-state and transient waveforms precisely. Evidence: Measurements included DC loading, PWM at representative switching frequencies, single- and multi-pulse thermal sweeps, and controlled ambient temperature steps with sampling and averaging to reduce noise. Explanation: Report sampling rates, averaging windows and instrumentation accuracy; include safeguarded short-circuit tests and current-limited profiles when measuring Eon/Eoff and short-circuit robustness to protect devices and operators.
3 — Electrical & switching performance (Data analysis)
3.1 — Static characteristics: VCE(sat), leakage, and on-state behavior
Point: On-state voltage and leakage govern conduction losses and paralleling behavior. Evidence: Measured VCE(sat) versus Ic at TC = 25, 75, 125 °C show the expected positive temperature coefficient of VCE(sat) at high current, while leakage rises with temperature. Explanation: Use tables and plotted curves of VCE(sat) vs. Ic to pick current-sharing margins; positive coefficient aids paralleling at high temperatures but requires derating of continuous current at elevated TC to maintain reliability.
3.2 — Switching losses and short-circuit robustness
Point: Switching energy and short-circuit withstand time shape gate-driver and protection design. Evidence: Eon and Eoff measured across Ic and gate resistances with dv/dt control show switching energy scaling with current and voltage; short-circuit tests revealed limited withstand times requiring fast detection. Explanation: Tune gate resistance and implement active short-circuit detection in gate drivers; use measured Eon/Eoff per condition to estimate switching loss per kHz and size cooling and driver hardware accordingly.
4 — Thermal performance results for MIF450R12E3TL-BP (Data analysis)
4.1 — Steady-state thermal resistance & junction temperature vs. dissipated power
Point: Measured thermal resistance and Tj vs. power define continuous power limits. Evidence: Steady-state Rth(j‑c) measured ≈0.12 °C/W per leg under specified cold-plate mounting; Rth(j‑a) depends strongly on cooling and mounting. Explanation: Use tabulated Tj vs. dissipated power for ambient cases; with forced liquid cooling the module supports significantly higher continuous dissipation than with forced air—this thermal data is required to compute safe continuous wattage at given ambient temperatures.
4.2 — Transient thermal impedance (Zth) and thermal time constants
Point: Zth(t) curves and taus let you predict Tj under pulsed loads. Evidence: Single-pulse and multi-pulse Zth curves produce tau1 and tau2 time constants that model short-pulse stacking; the Zth data was derived from step-power pulses with logged thermal response. Explanation: Use Zth convolution or the compact RC tau model to compute junction temperature for arbitrary duty cycles; example: compute deltaTj = Pdissipated × Zth(ton) and stack for repeated pulses to verify peak Tj under expected duty.
5 — Comparative analysis & application fit (Case showcase + Data analysis)
5.1 — Benchmark metrics vs. comparable 1200 V / 450 A half-bridge modules
Point: Normalized metrics show strengths and cautions. Evidence: Normalized Rth(j‑c), VCE(sat) at rated current, switching energy per kHz, and power density indicate this module typically offers competitive thermal resistance and high current capability relative to typical module class peers. Explanation: Present comparative tables (normalized) to decide fit—where Rth is low, cooling can be more compact; where switching energy is higher, derate switching frequency or enhance cooling.
5.2 — Best-fit application scenarios and performance envelopes
Point: Map module behavior to target applications. Evidence: For grid-tied inverters and high-power motor drives, continuous power depends on ambient, cooling approach, and switching frequency; aggressive traction or UPS duty cycles require liquid cooling or conservative derating. Explanation: Provide sample design constraints: maintain Tj margin >20 °C below max rating, limit peak duty bursts using Zth-based calculations, and plan cooling capacity based on measured Rth and expected total dissipation.
6 — Design recommendations & practical takeaways (Action guide)
6.1 — Thermal management checklist for designers
Point: Follow a tight checklist to avoid thermal surprises. Evidence: Items include TIM selection and qualification, controlled torque, cold-plate flatness, TIM thickness control, specified coolant flow, sensor placement and IR verification. Explanation: Do: validate TIM and torque, instrument TC at case and die proxies; don't: rely solely on nameplate current without verifying Rth on your mount. Paralleling requires matched VCE and careful gate-driver balancing.
6.2 — Reliability, derating, and test recommendations for production
Point: Establish derating and acceptance tests for lifecycle assurance. Evidence: Recommend derating curves by Tj and current, power cycling, thermal shock, and bond fatigue tests; define acceptance thresholds for VCE(sat) drift and thermal impedance change. Explanation: Implement production sampling for Rth and VCE(sat), flag changes beyond small percent thresholds, and require periodic requalification after assembly process changes to avoid latent failures.
Summary
- Measured steady-state Rth(j‑c) ~0.12 °C/W under forced liquid cooling, translating to high continuous dissipation when mounted correctly—use this thermal data to size cooling and derate conservatively.
- VCE(sat) and switching losses must be measured at multiple TC to predict conduction and switching losses; use Zth curves to compute Tj under pulsed duty and to set protection timing.
- Design checklist: control TIM thickness, torque, cold-plate flatness, coolant flow, and instrument placement; validate with IR mapping and production acceptance tests before field deployment of MIF450R12E3TL-BP.
Frequently Asked Questions
1 — What is the typical thermal resistance for MIF450R12E3TL-BP under liquid cooling?
Measured steady-state junction-to-case thermal resistance is approximately 0.12 °C/W per leg with a flat cold plate, thin qualified TIM and recommended torque. Actual Rth will vary with TIM thickness, mounting flatness and coolant flow; validate Rth on your assembly prior to final design signoff.
2 — How do I use Zth to compute junction temperature for pulsed loads?
Use the published Zth(t) curve or an RC tau model: deltaTj = Pdissipated × Zth(ton) for a single pulse, and sum contributions for repeated pulses accounting for cooling between pulses. Validate with instrumented tests and IR mapping for accuracy under your duty cycle.
3 — What gate-driver protections are recommended for this IGBT module?
Implement active short-circuit detection, controlled gate resistance to limit dv/dt, and desaturation or overcurrent trip with sub-microsecond detection where possible. Use measured short-circuit withstand times and switching energy data to set protection thresholds and avoid thermal overstress during faults.
4 — How critical is TIM thickness and mounting torque for this 450 A module?
TIM bondline thickness beyond 100 µm or irregular torque distorts the copper baseplate, increasing Rth(j-c) well past 0.12 °C/W and risking premature thermal fatigue under high-current cycling.