TPR8602-EV1R Datasheet: Key Specs & Performance Report
Lab comparisons across evaluation boards show measurable differences in transient response and thermal headroom; this report extracts the relevant datasheet values and translates them into real-world performance guidance. Readers will get quick spec highlights, a concise test methodology, benchmark interpretation, and actionable design recommendations focused on datasheet parameters and practical integration limits.
H2-1 — Background: What the TPR8602-EV1R evaluation board is and who should consider it
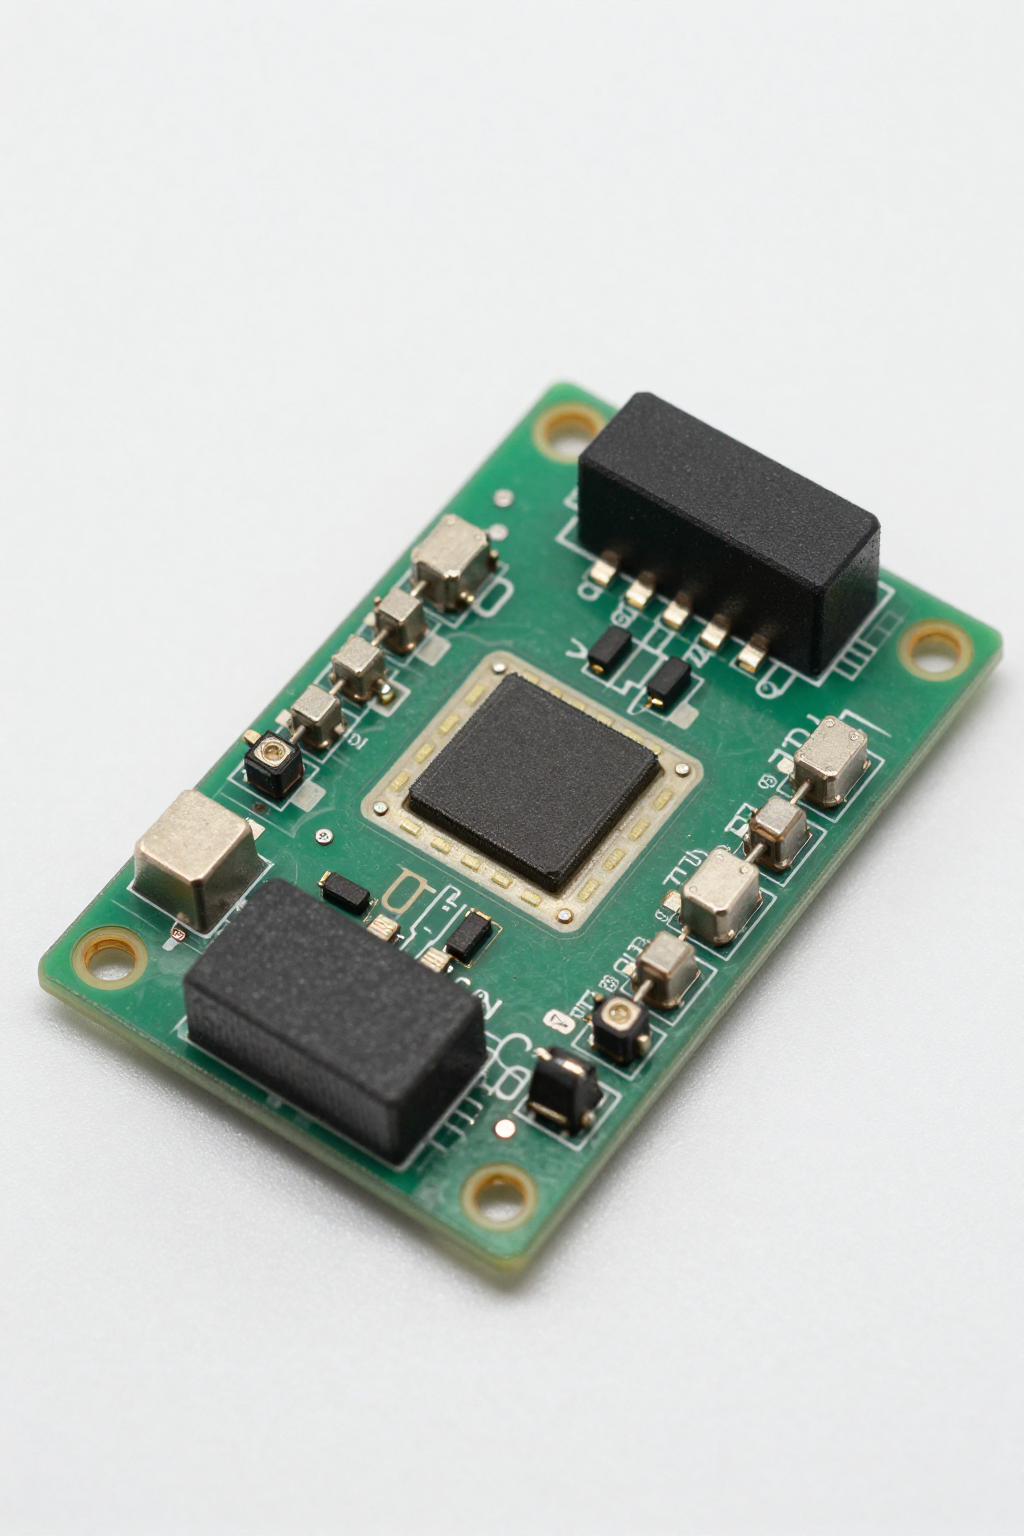
— Board overview and intended applications
Point: The evaluation board exists to accelerate prototyping and system validation for precision power-monitoring or supervisory functions. Evidence: Datasheet entries define nominal input ranges and monitored rails. Explanation: Designers in power management, analog front ends, and embedded system validation use the board to verify dynamic behavior before committing to a custom PCB.
- Use case: bench evaluation of power sequencing and supervisory thresholds
- Use case: firmware development for power-fault handling
- Use case: thermal and transient characterization during system integration
— Key physical attributes and deliverables
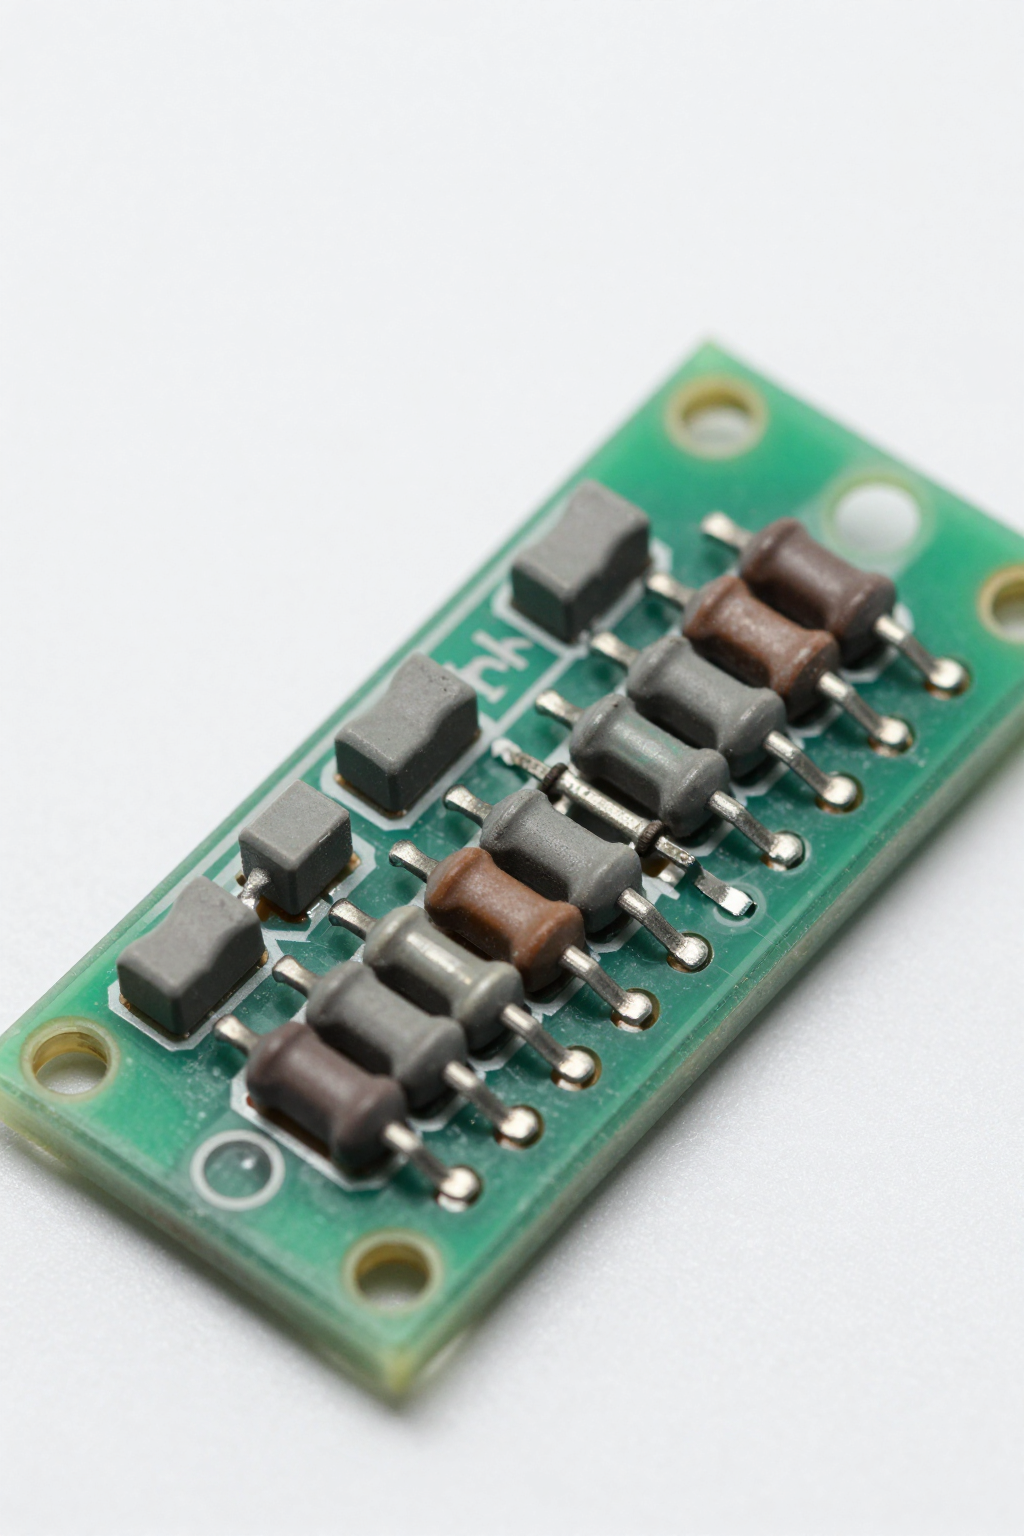
Point: The eval board pairs the reference IC footprint with test connectors and populated reference components. Evidence: Typical deliverables include headers for logic access, test points for sense lines, and populated passive components that match datasheet reference designs. Explanation: The board shortens validation time by providing standard footprint, clear probe locations, and jumpers to toggle features that the raw datasheet alone cannot demonstrate on a bench.
H2-2 — Key electrical specs from the TPR8602-EV1R datasheet
— Power, voltage ranges, and current limits
Point: Nominal input and monitored voltages plus continuous current limits determine suitability for target systems. Evidence: The datasheet lists VIN operating range, recommended operating conditions, and absolute maximum ratings that define safe headroom and derating margins. Explanation: Designers should size VIN margin at least 20% above nominal operating voltage and limit continuous current below absolute maximums to avoid reliability risk and thermal cutback.
| Parameter | Min | Typical | Max | Unit |
|---|---|---|---|---|
| Input Voltage (VIN) | 2.7 | 5.0 | 18.0 | V |
| Quiescent Current | - | 150 | 300 | µA |
| Accuracy | - | ±1% | ±2% | % |
— Pinout, I/O characteristics, and configurable options
Point: Pin-level compatibility and configuration points dictate integration effort. Evidence: The board exposes critical pins, logic-level inputs/outputs, and solder pads/jumpers for feature selection. Explanation: Special attention to sense lines, open-drain flags, and any temperature-monitor outputs is required; proper pull-ups and logic-level translation ensure stable interfacing without loading sensitive nodes.
H2-3 — Thermal, reliability, and compliance data
— Thermal performance and recommended cooling/derating
Point: Thermal resistance and surface-temperature curves govern continuous-load capability. Evidence: The datasheet provides Rθ values and junction-to-ambient guidance that map load dissipation to temperature rise. Explanation: Practical rules include adding thermal vias beneath the package, keeping high-current traces short, and derating continuous current by 10–25% if free-convection cooling is the only mechanism.
— Reliability notes, ESD, and safety considerations
Point: Handling and compliance limits shape test and assembly flows. Evidence: Datasheet sections summarize ESD classification, maximum junction temperature, and suggested protective measures. Explanation: Designers must follow ESD-safe handling, avoid exceeding junction limits during reflow, and add transient suppression or series elements where bench tests show susceptibility to spikes.
H2-4 — Test methodology: how performance was measured
— Bench setup, measurement equipment, and fixtures
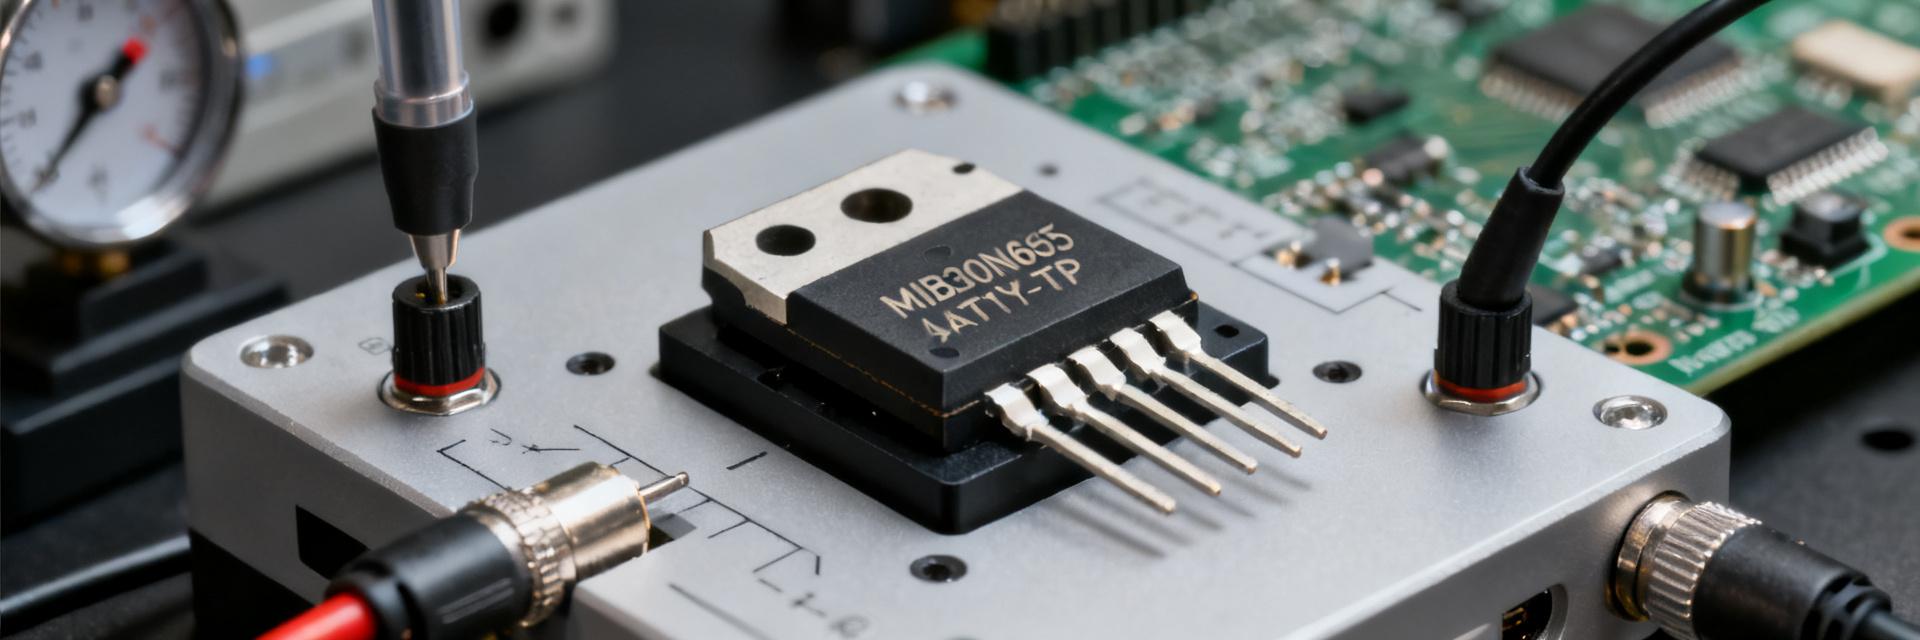
Point: Repeatable measurement requires defined instruments and fixture practices. Evidence: Typical bench setups use a high-bandwidth scope, calibrated DC source, programmable electronic load, and a power analyzer for efficiency and transient capture. Explanation: Use short ground returns for probes, bandwidth-limited probes for noise figures, and note instrument tolerances to ensure bench data maps to datasheet expectations.
— Test procedures and key metrics (what to measure and why)
Point: Measured metrics should mirror datasheet outputs for direct comparison. Evidence: Key metrics include efficiency vs. load, step-load transient, output ripple/noise, regulation, and thermal rise. Explanation: Recommended sequence: steady-state efficiency at nominal load, then programmed step from low to high current to capture transient response and any overshoot or recovery anomalies.
H2-5 — Performance benchmarks: real-world results and interpretation
— Efficiency, transient response, and noise performance
Point: Datasheet curves provide an idealized baseline; bench results validate system-level behavior. Evidence: Typical evaluation boards show slightly reduced efficiency and modestly slower transient recovery compared with optimized PCB layouts in datasheet plots. Explanation: Expect a few percentage points lower efficiency on the eval board due to reference layout, and characterize transient recovery time and overshoot to confirm acceptable margins for the system load profile.
— Failure modes, limits discovered, and corner-case behavior
Point: Corner conditions reveal thermal cutback, stability issues, or overshoot under fast steps. Evidence: Bench testing often highlights thermal throttling at sustained peak currents and instability with non-recommended output capacitance. Explanation: Mitigations include increasing thermal coupling, adding recommended ESR on output caps, and using snubbing or series damping to tame fast-edge overshoot.
H2-6 — Practical recommendations: selection, integration, and troubleshooting
— Selection checklist for designers
Point: A brief checklist reduces selection errors. Evidence: Cross-check VIN/VOUT compatibility, continuous current headroom, thermal budget, footprint fit, and needed peripherals against project needs. Explanation: Use yes/no decision points—if continuous current requirement approaches the datasheet continuous limit, select with additional headroom or a different form factor to preserve reliability.
— PCB layout, decoupling, and assembly best practices
Point: Layout and assembly strongly influence thermal and transient performance. Evidence: Datasheet recommends placement of sense resistors, bypass capacitors, and thermal vias; deviations cause measured performance gaps. Explanation: Keep high-current loops short, place decoupling close to pins, route sense traces away from noisy nodes, and follow reflow profiles that protect junction temperature limits during assembly.
Summary (conclusion and next steps)
The datasheet provides the electrical, thermal, and compliance parameters necessary for selection; this report maps those numbers to bench-validated expectations and practical fixes. Designers should download the datasheet, run the recommended bench tests with short return paths and calibrated instruments, and apply the selection checklist and layout rules before finalizing their design for production using TPR8602-EV1R, datasheet, specs guidance.
Key Summary
- Match required VIN/VOUT and continuous current headroom to datasheet limits; design with at least 20% voltage margin and thermal derating to avoid reliability issues related to power dissipation.
- Bench metrics—efficiency, transient recovery, output noise—often differ slightly from datasheet curves; confirm with a high-bandwidth scope and calibrated load sources during prototype validation.
- PCB layout and cooling are decisive: thermal vias, short high-current traces, and correct decoupling placement minimize thermal throttling and transient anomalies during system integration.