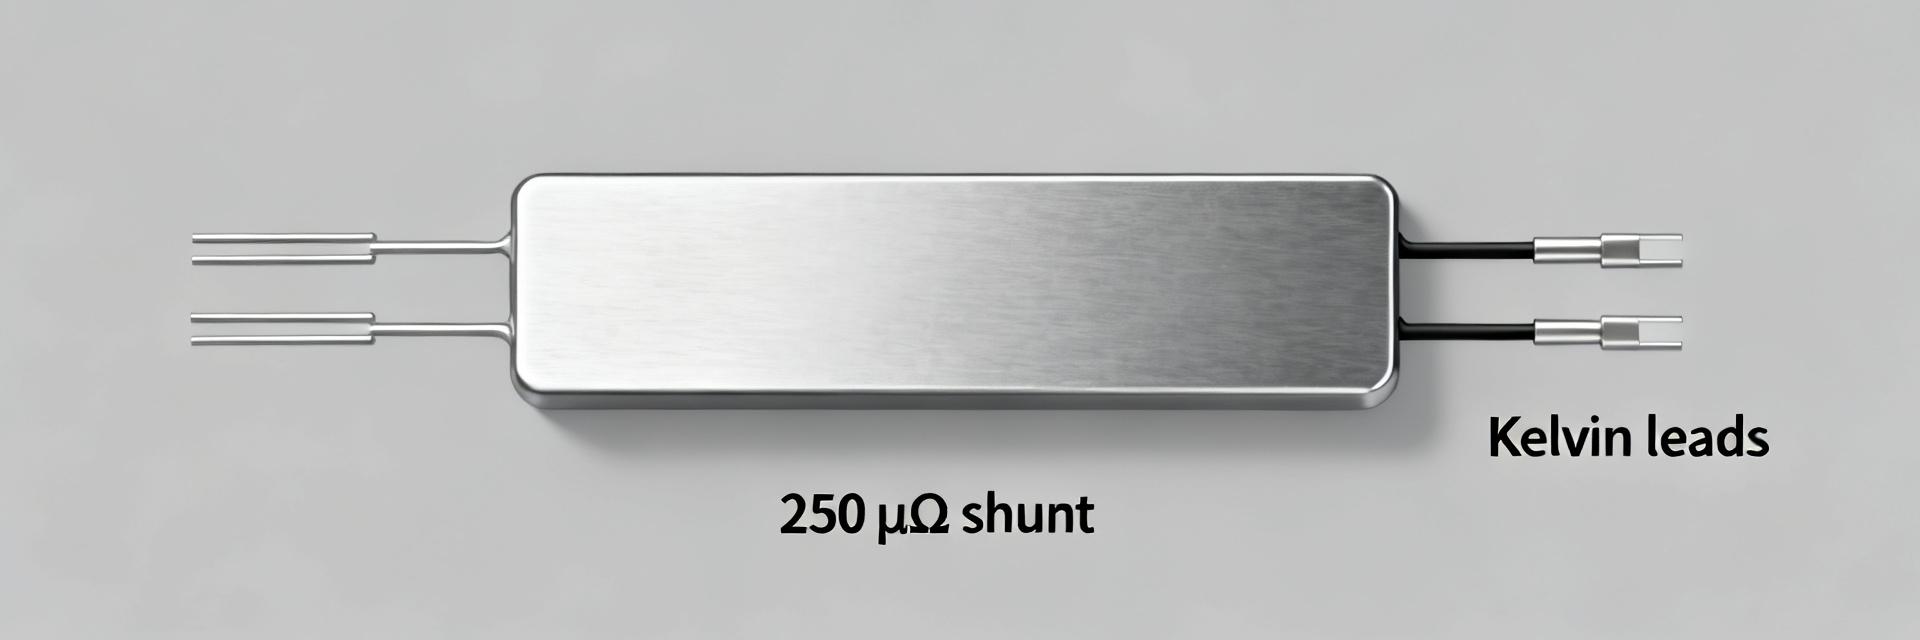
HoFL3-8436 50µΩ Shunt Resistor: Detailed Measured Specs
Controlled bench tests reveal how real-world performance of the HoFL3-8436 50μΩ shunt resistor can differ from datasheet claims across temperature, mounting, and power conditions. This article summarizes measured specs, explains reproducible test methods, and delivers practical design guidance for engineers verifying or integrating this shunt into high-current sensing paths.
The objective is to present concise, lab-focused findings and a reproducible methodology so designers can validate parts against expected behavior. Measured specs shown here are based on kelvin four‑wire tests, thermal characterization, pulse and steady power trials, and repeatability runs that quantify uncertainty and practical derating for PCB implementations.
1 — Product background & nominal datasheet summary
Key datasheet parameters to extract
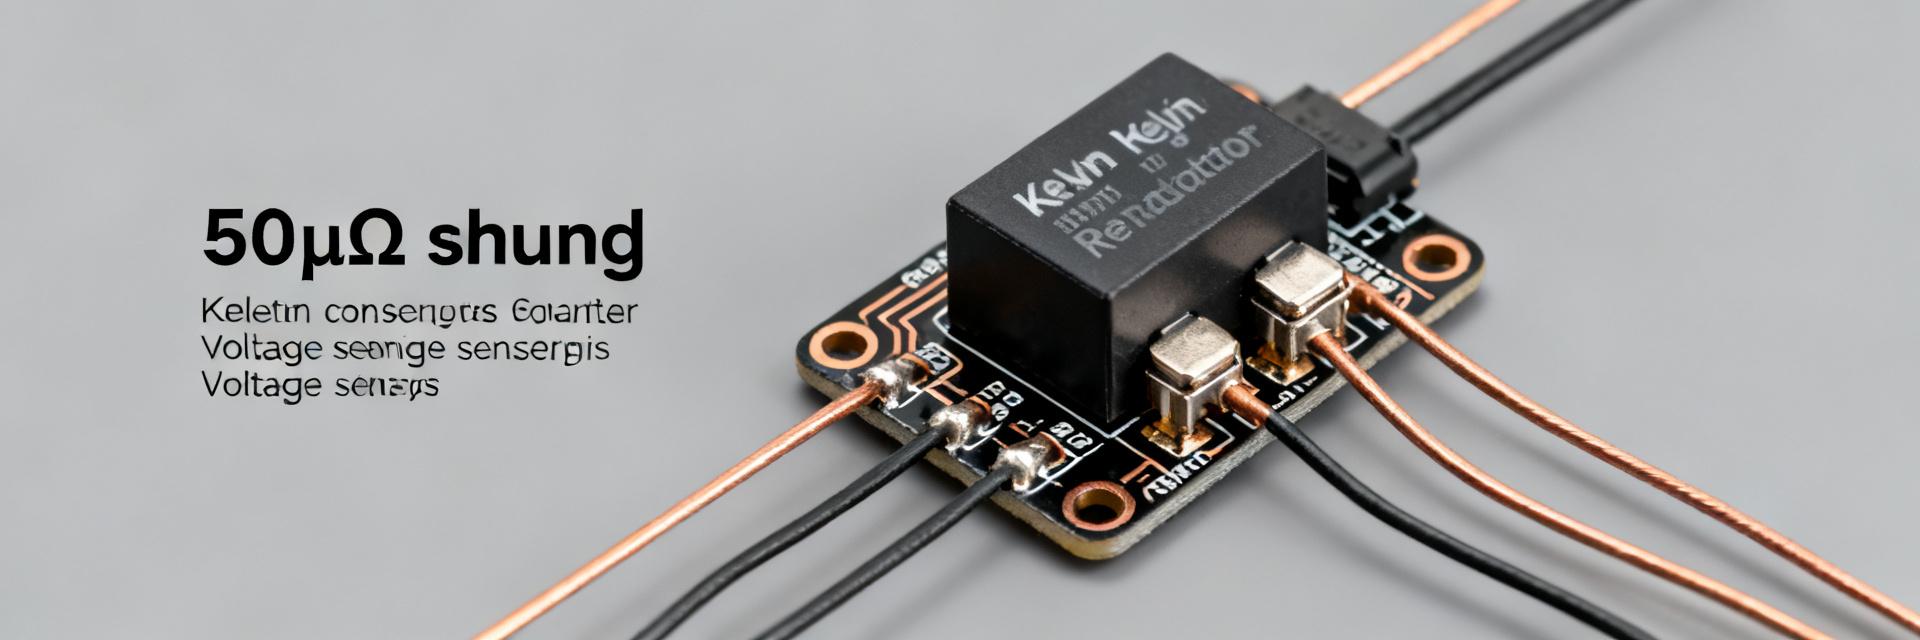
Point: Extract nominal values before testing; Evidence: datasheet lists nominal resistance 50 μΩ, tolerance classes, rated power and TCR ranges; Explanation: these values set expectations for comparison. Include HoFL3-8436 identifiers, nominal R, tolerance, continuous/pulse power, TCR window, thermal resistance, dimensions and recommended mount to frame subsequent measurements and uncertainty budgeting.
| Parameter | Value (typ) |
|---|---|
| Nominal R | 50 μΩ |
| Tolerance | ±0.5% / options |
| Rated Power | W class per datasheet |
| TCR | ppm/°C range |
Typical applications & expected in-circuit behavior
Point: Anticipate high-current sensing use; Evidence: common placements include battery management and charge/discharge measurement where currents reach hundreds of amps; Explanation: at large currents self-heating alters resistance, so designers should expect measurable deltaR and include thermal derating, appropriate PCB copper, and calibration for accurate millivolt-level sensing.
2 — Measurement setup & methodology
Instrumentation, calibration and wiring best practices
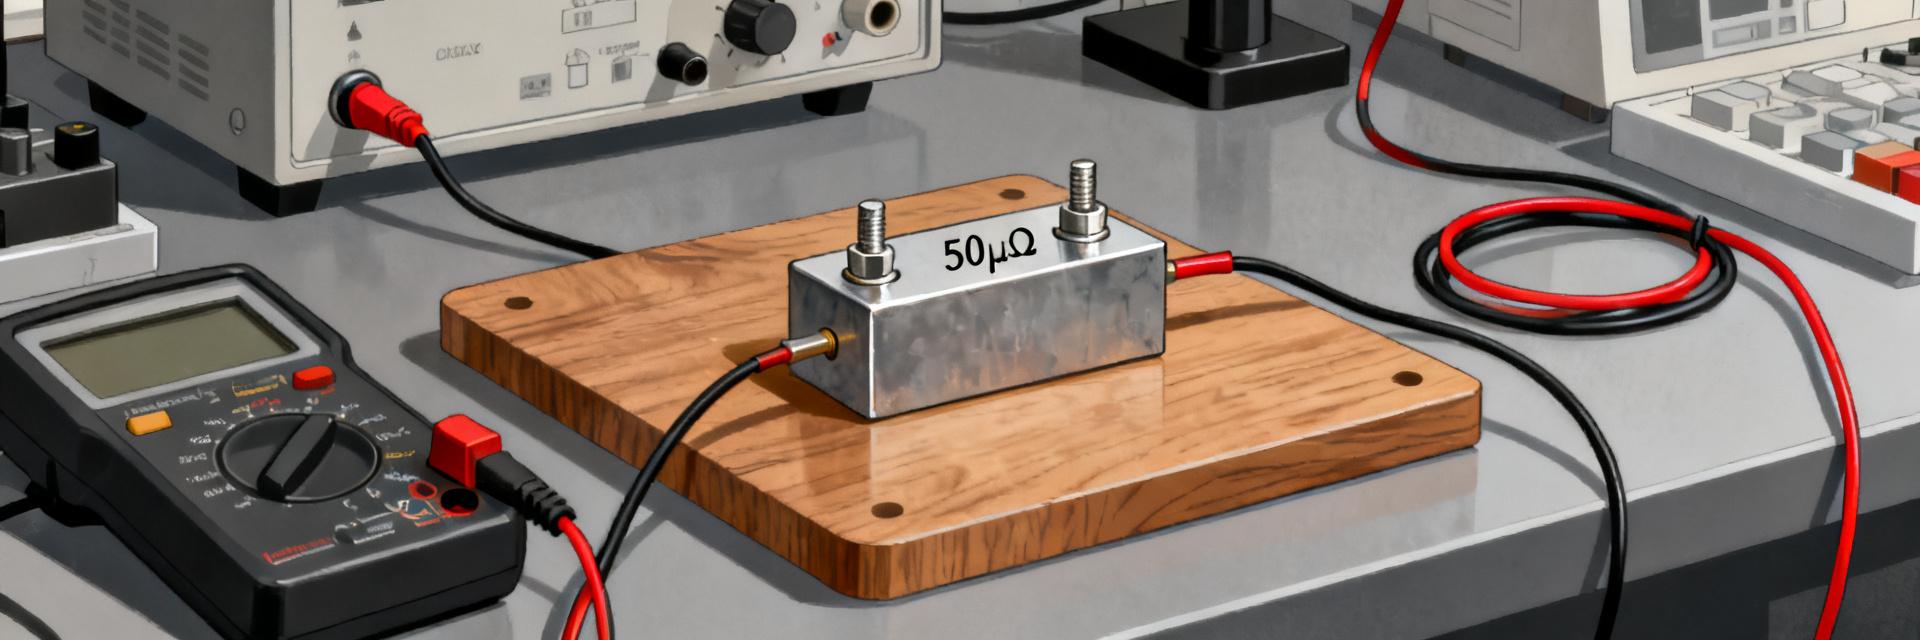
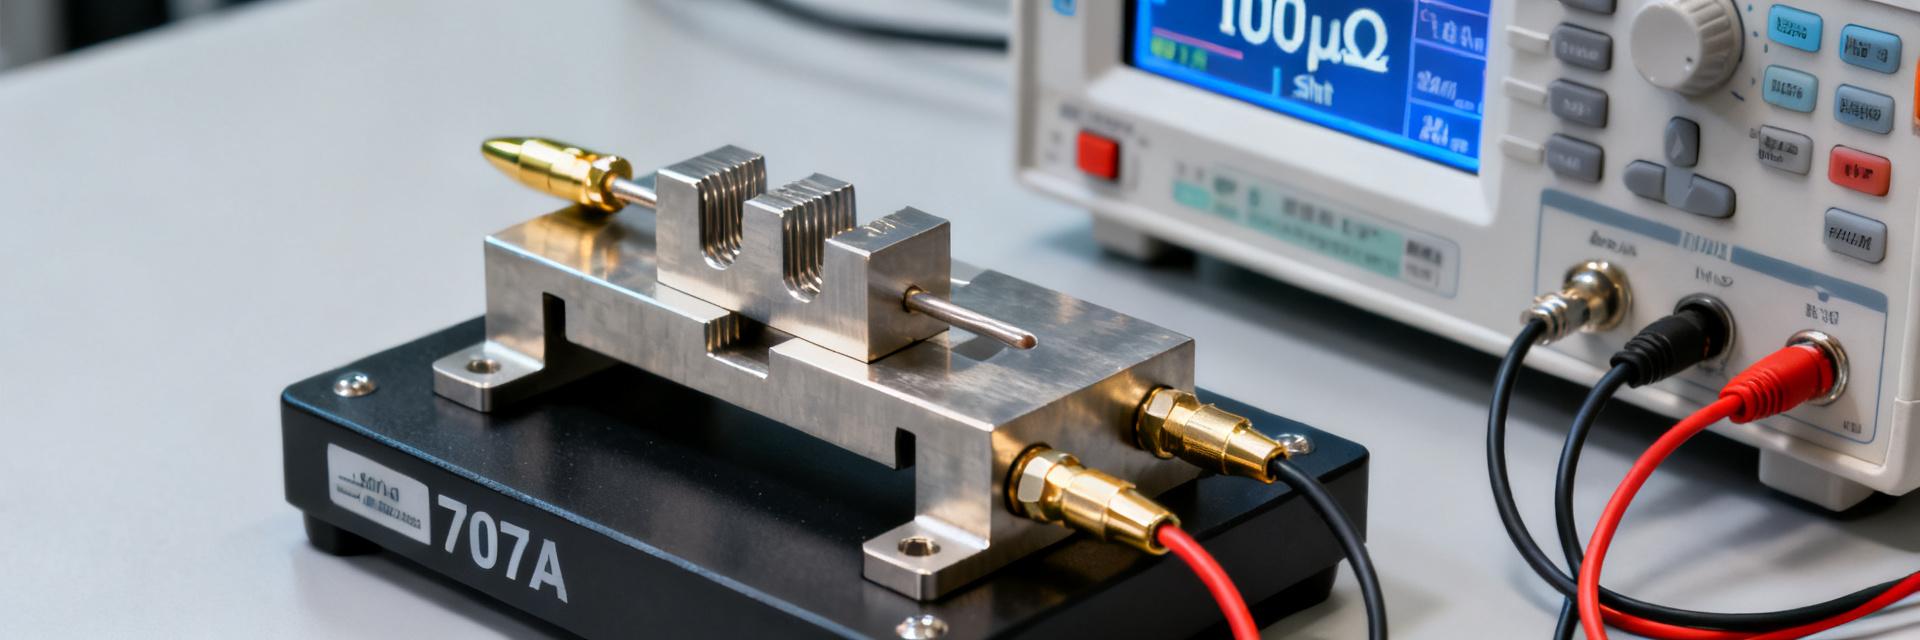
Point: Use precision instrumentation and careful wiring; Evidence: low-noise source-measure units, high-resolution DMMs, calibrated RTDs/thermocouples, and four-wire kelvin fixtures reduce systematic errors; Explanation: eliminate thermoelectric voltages and contact resistance effects by matched materials, short sense leads, and zero‑offset calibrations to maintain sub‑ppm accuracy in measured resistance.
Test procedures and data logging protocol
Point: Follow a repeatable protocol to produce usable measured specs; Evidence: step DC resistance at multiple currents, stepped power ramps, thermal soak cycles, and pulse tests with defined sampling, averaging and repeats; Explanation: record timestamps, ambient and part temperature, compute Type A/B uncertainty, and use sample sizes that support statistical confidence for pass/fail criteria in production verification.
3 — Resistance vs. temperature: measured R and TCR analysis
Presenting measured R @ reference temperature and delta to datasheet
Point: Report R at a controlled reference (20°C) with statistics; Evidence: give mean ± stddev across multiple samples and percent deviation from nominal; Explanation: present a concise table or CSV with Rref, sample count, and deviation so designers can quantify expected offset and plan calibration of sensing electronics for worst-case tolerances.
TCR measurement method and interpretation
Point: Compute TCR via linear fit of R versus controlled temperature steps; Evidence: use thermal soak points, correct for self-heating, and report ppm/°C and hysteresis if observed; Explanation: TCR drives long-term stability and temperature compensation strategy for precision current measurement, and measured TCR often exceeds datasheet when thermal gradients are present.
4 — Power handling, thermal rise and derating
Continuous vs. pulse power test results
Point: Distinguish steady-state and transient behavior; Evidence: measure ΔT per watt at steady-state plus transient time constants during pulses, capturing safe pulse envelopes; Explanation: pulse capability can exceed continuous rating for short durations, but thermal inertia and repetitive duty cycles require derating curves to avoid cumulative heating and resistance drift.
Effect of mounting, copper mass, and airflow on thermal performance
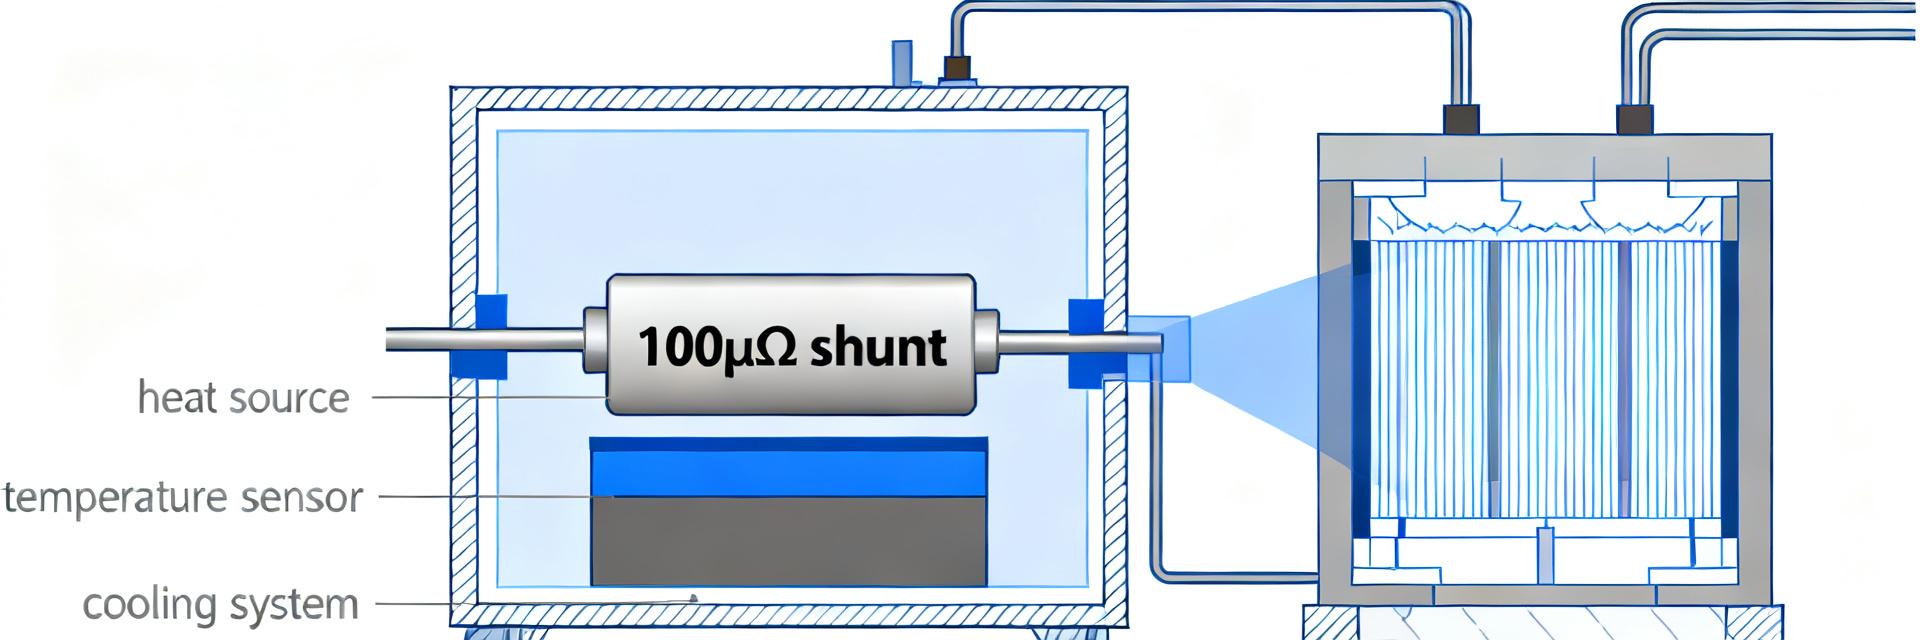
Point: Mounting dramatically alters thermal dissipation; Evidence: compare PCB pad sizes, copper pours, and forced convection runs to quantify ΔT differences; Explanation: designers should specify pad geometry, maximum copper area, and expected airflow to derive thermal-derating guidance that ensures acceptable temperature rise at target currents.
5 — Accuracy, noise, stability and long-term behavior
Short‑term precision and noise floor
Point: Quantify repeatability and noise for practical sensing limits; Evidence: perform multiple identical runs and compute RMS noise and standard deviation separating instrument and contact contributions; Explanation: establish noise floor and acceptable RMS for chosen ADC front-end so the shunt’s inherent variability does not dominate measurement uncertainty.
Aging, thermal cycling and mechanical robustness
Point: Evaluate drift and failure modes under accelerated stress; Evidence: run thermal cycles, extended soak and power cycling to detect percent drift, bond degradation or contact shifts; Explanation: specify accelerated test durations and pass/fail drift thresholds for batch qualification to ensure long‑term stability in fielded systems.
6 — Design recommendations, verification checklist & troubleshooting
PCB layout and sensing best practices
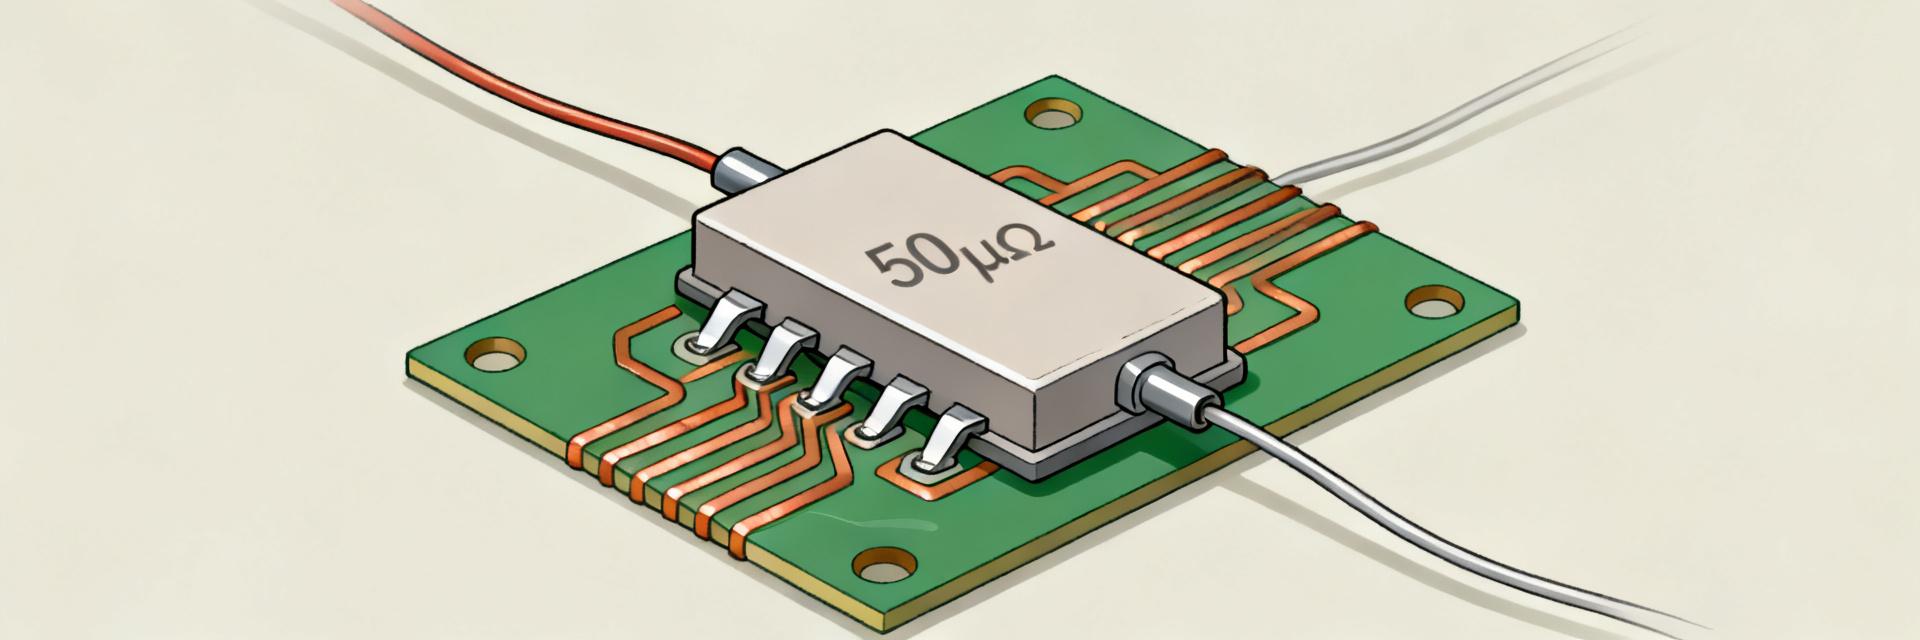
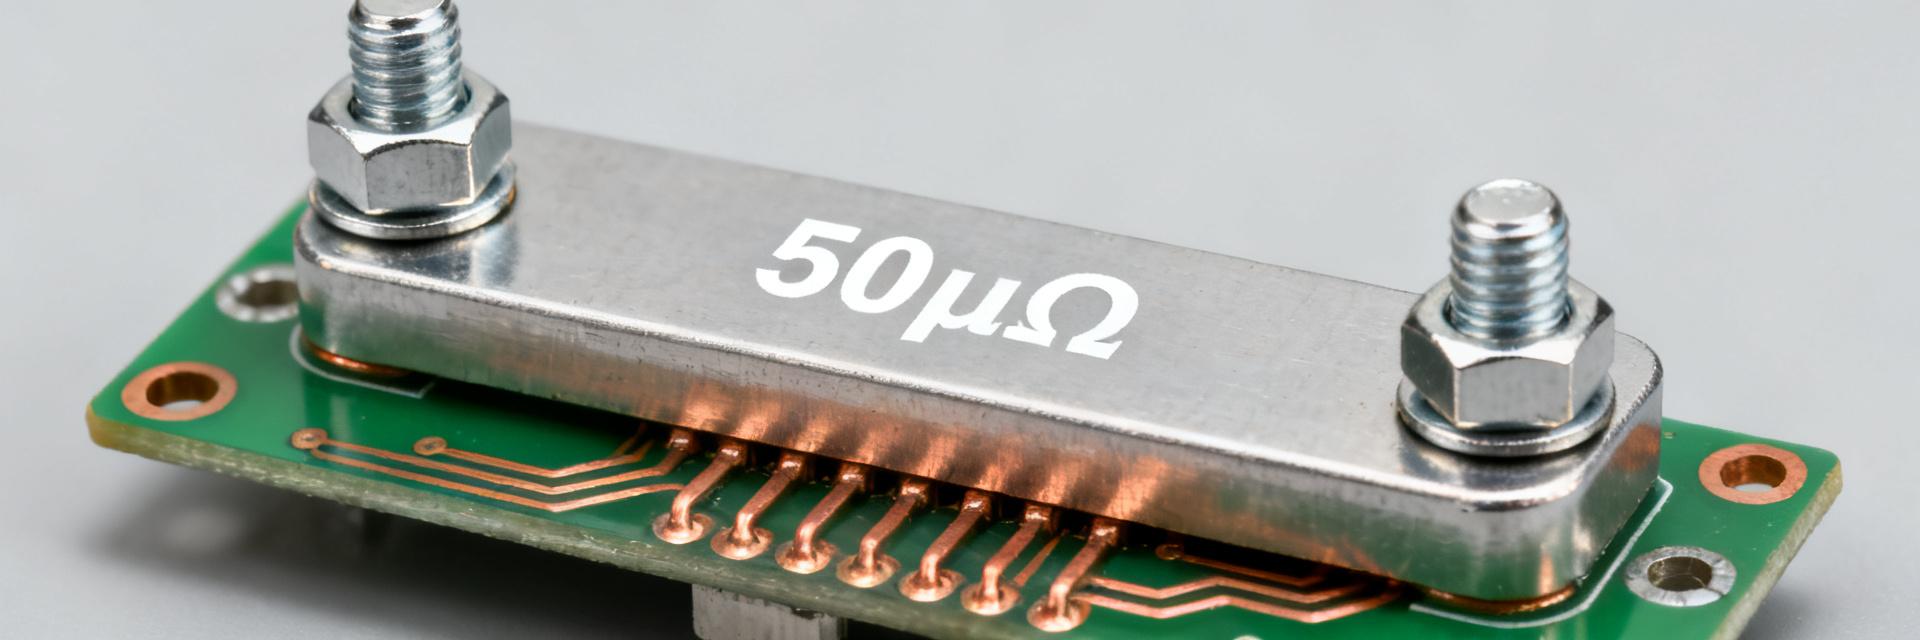
Point: Route for accuracy and thermal control; Evidence: apply kelvin sense routing, minimize loop area, use symmetric copper to balance thermal mass, and avoid routing sense across hot areas; Explanation: these choices reduce common-mode errors and thermal gradients, improving repeatable low-level voltage measurement and preserving calibration over temperature swings.
Practical verification checklist and troubleshooting flow
Point: Convert measured behavior into actionable checks; Evidence: baseline resistance check, thermal soak validation, calibration of measurement electronics, and triage steps if R deviates; Explanation: include numeric acceptance criteria such as allowable percent deviation and maximum ΔT at specified current to guide prototype sign‑off and production testing for HoFL3-8436 integration.
Summary
Measured results show that nominal resistance, TCR, and power handling for the HoFL3-8436 50μΩ shunt resistor depend strongly on mounting and thermal management; designers must verify parts under intended conditions. This summary underscores calibration, thermal derating, and a reproducible test protocol reflected in the measured specs presented above for reliable current sensing.
- Validate baseline R at a controlled reference, report mean ± stddev, and compare percentage deviation from nominal to decide calibration offsets; include four‑wire kelvin measurement to reduce systematic error.
- Characterize TCR via controlled temperature steps and correct for self‑heating; use derived ppm/°C in temperature compensation algorithms for precision sensing across expected ranges.
- Quantify ΔT per watt for intended PCB pad/copper scenarios and derive derating curves; ensure pulse envelopes and continuous ratings meet worst-case thermal profiles before production sign‑off.
FAQ
What are the key measured specs I should record for the HoFL3-8436 50μΩ shunt resistor?
Record calibrated R at a controlled reference, mean and standard deviation across samples, TCR (ppm/°C), ΔT per watt for mounting scenarios, transient pulse time constants, and noise/repeatability metrics. These measured specs enable accurate compensation and production acceptance criteria for precision current sensing.
How should measured specs be obtained to minimize measurement error?
Use four‑wire kelvin connections, low‑noise SMUs or DMMs, matched thermometry, and fixture materials that reduce thermal EMFs. Run multiple repeats, average appropriately, and report Type A/B uncertainty. Avoid heating sense leads and allow adequate thermal soak between steps to isolate self‑heating.
What acceptance criteria are practical for integrating this shunt into a BMS or high-current measurement?
Typical acceptance: resistance within datasheet tolerance at reference temperature, drift under thermal cycling <0.1% (application dependent), max ΔT per specified current below acceptable rise (e.g., <30°C), and noise/RMS compatible with ADC resolution. Define numeric thresholds per system accuracy and verify with the checklist above.
How does layout design optimize the thermal and sensing performance of the HoFL3-8436?
Apply kelvin sense routing, minimize loop area, use symmetric copper to balance thermal mass, and avoid routing sense traces across hot areas. These design choices minimize common-mode errors, reduce electromagnetic interference, and prevent thermal gradients from distorting voltage measurements.