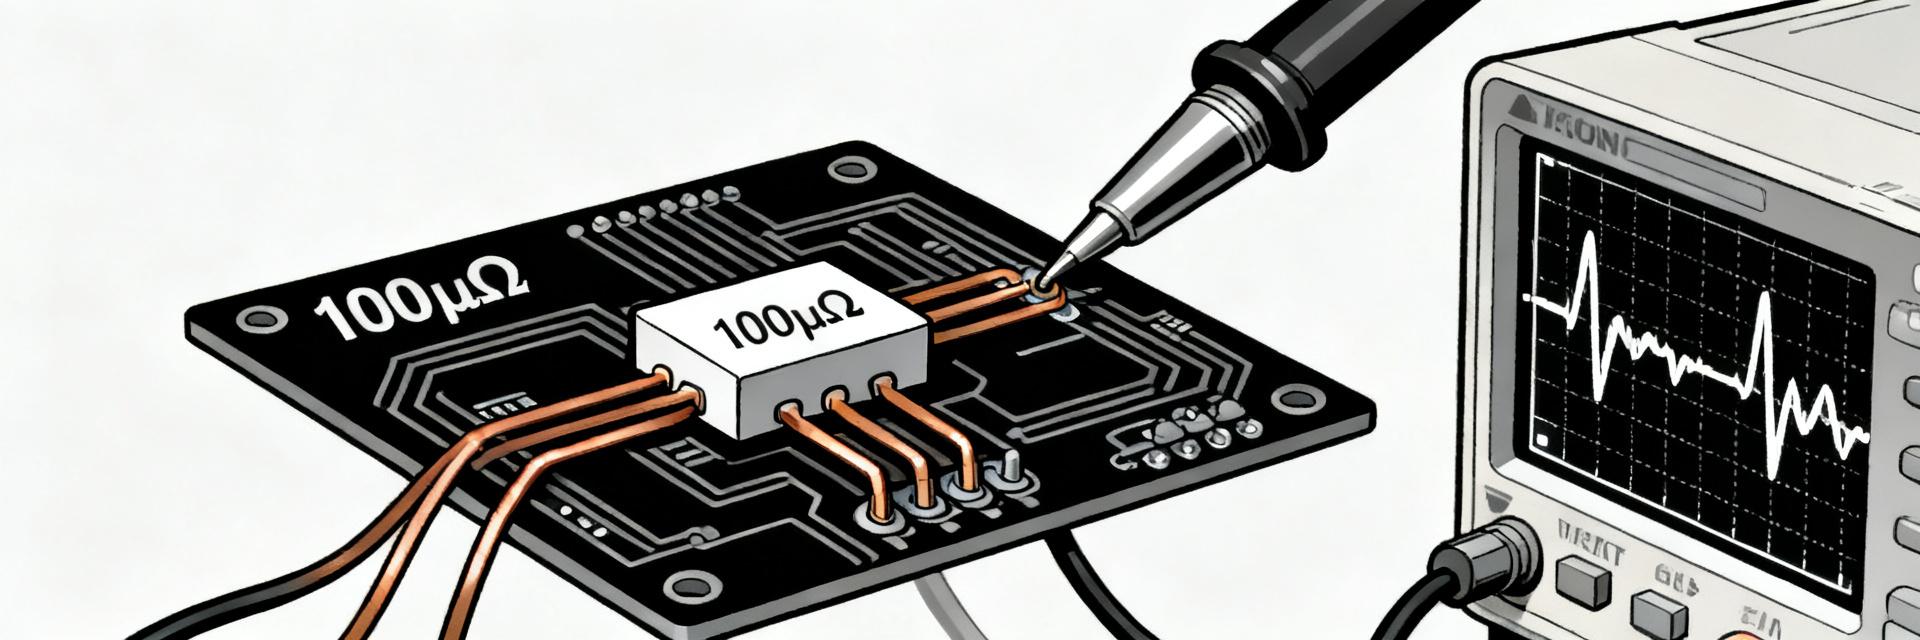
100 µΩ Shunt Resistor Performance Report — 50W Bench Data
Introduction (data-driven hook)
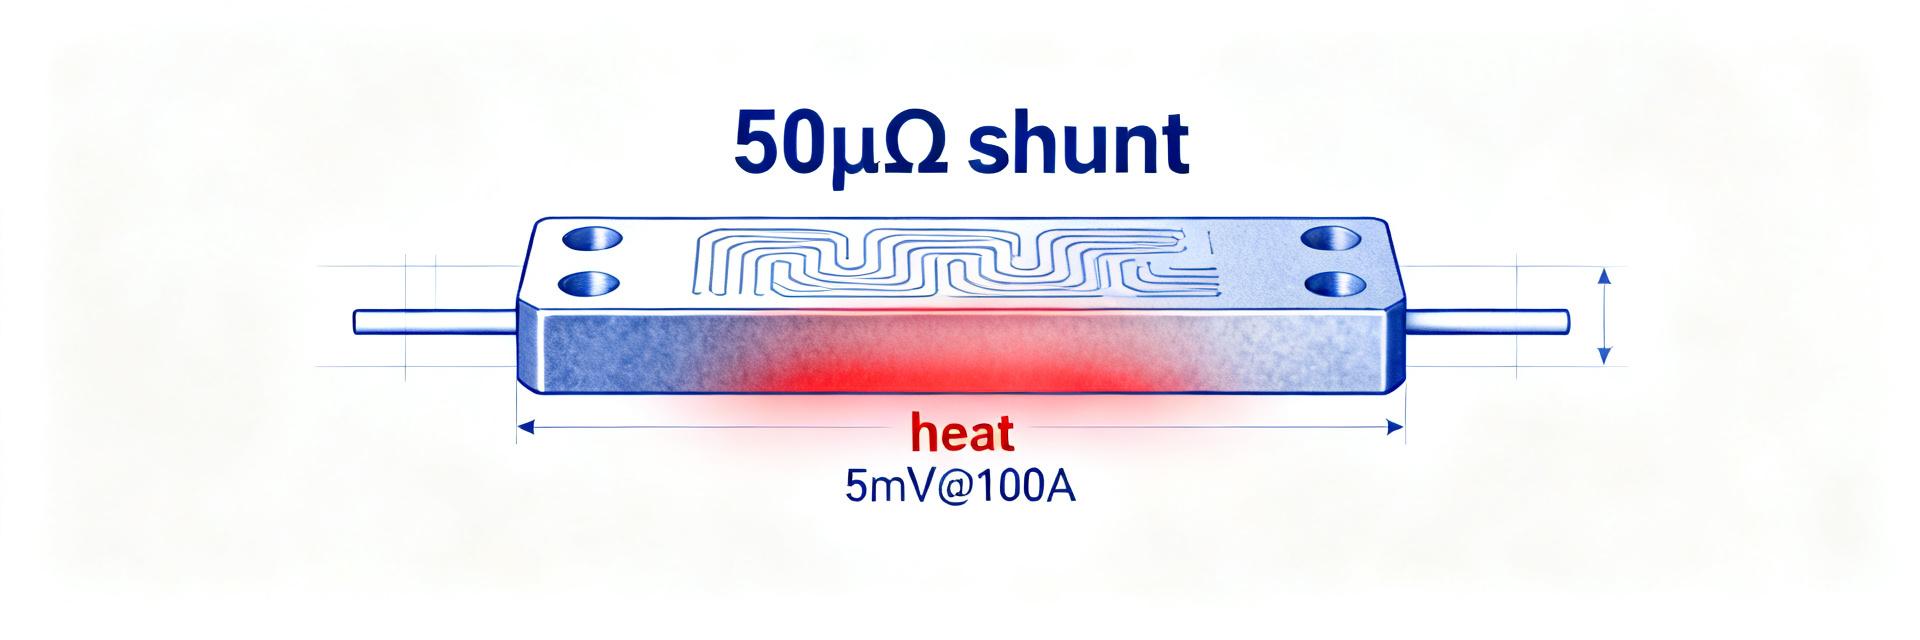
Recent bench runs produced consistent electrical and thermal outcomes when a 100 µΩ shunt was driven to a 50 W dissipation point. Steady-state operation near 707 A yielded ~70.7 mV Vdrop under controlled airflow. This summary frames reproducible measurement practice and error control so test engineers can reproduce the listed 50W bench data and trust results in high-current sensing work.
1 — Background & key specifications for a 100 µΩ shunt resistor
Typical electrical specs to call out
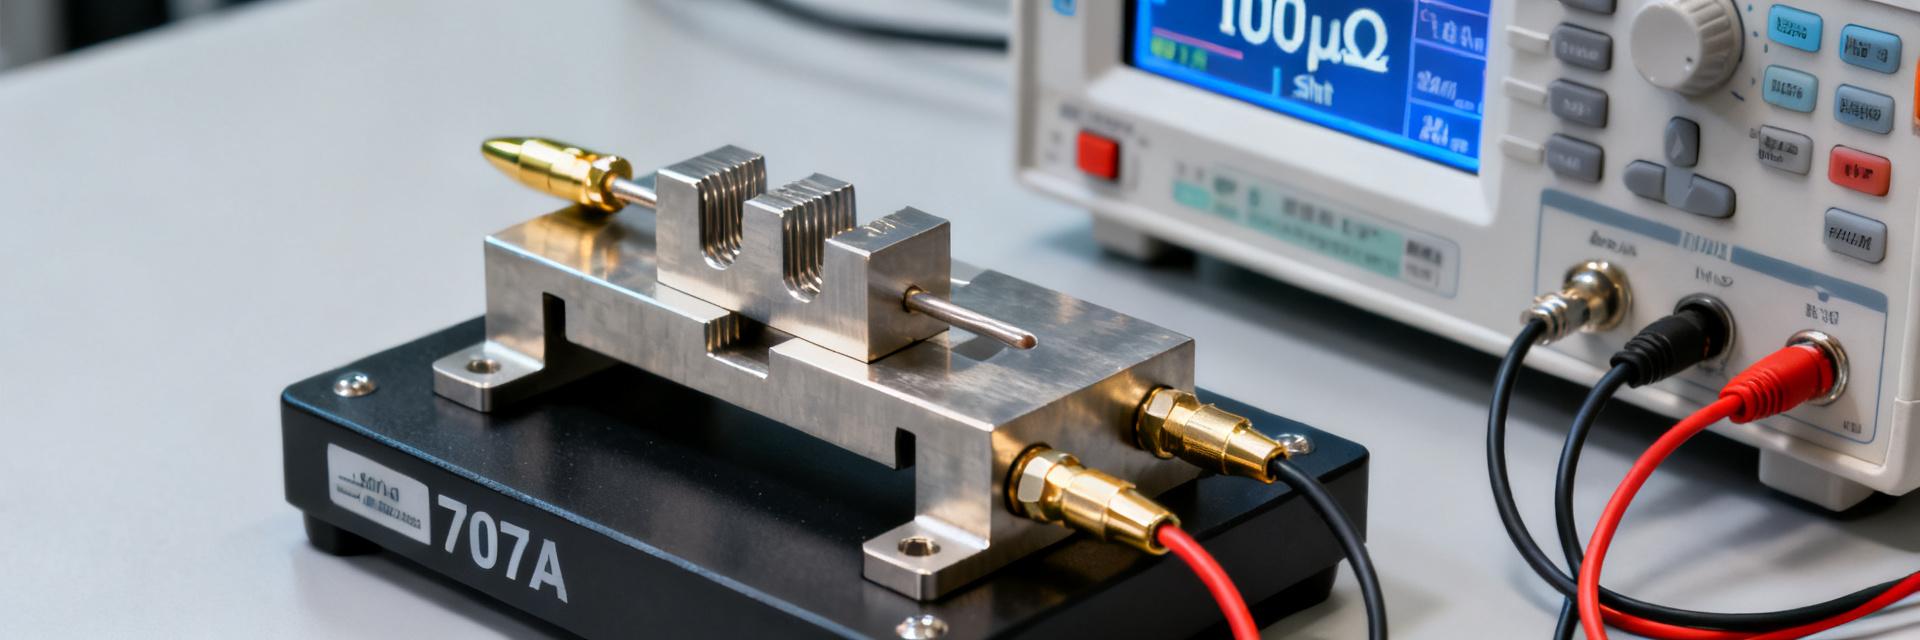
Nominal specs govern safe use and measurement expectations. List items to record include nominal 100 µΩ, tolerance options (±0.5%–1%), rated power 50 W, TCR in ppm/°C, and long-term drift. Documenting test conditions (ambient, mounting) alongside these values is essential for traceable comparison and calibration of measured resistance under load.
Physical form factors & mounting relevance
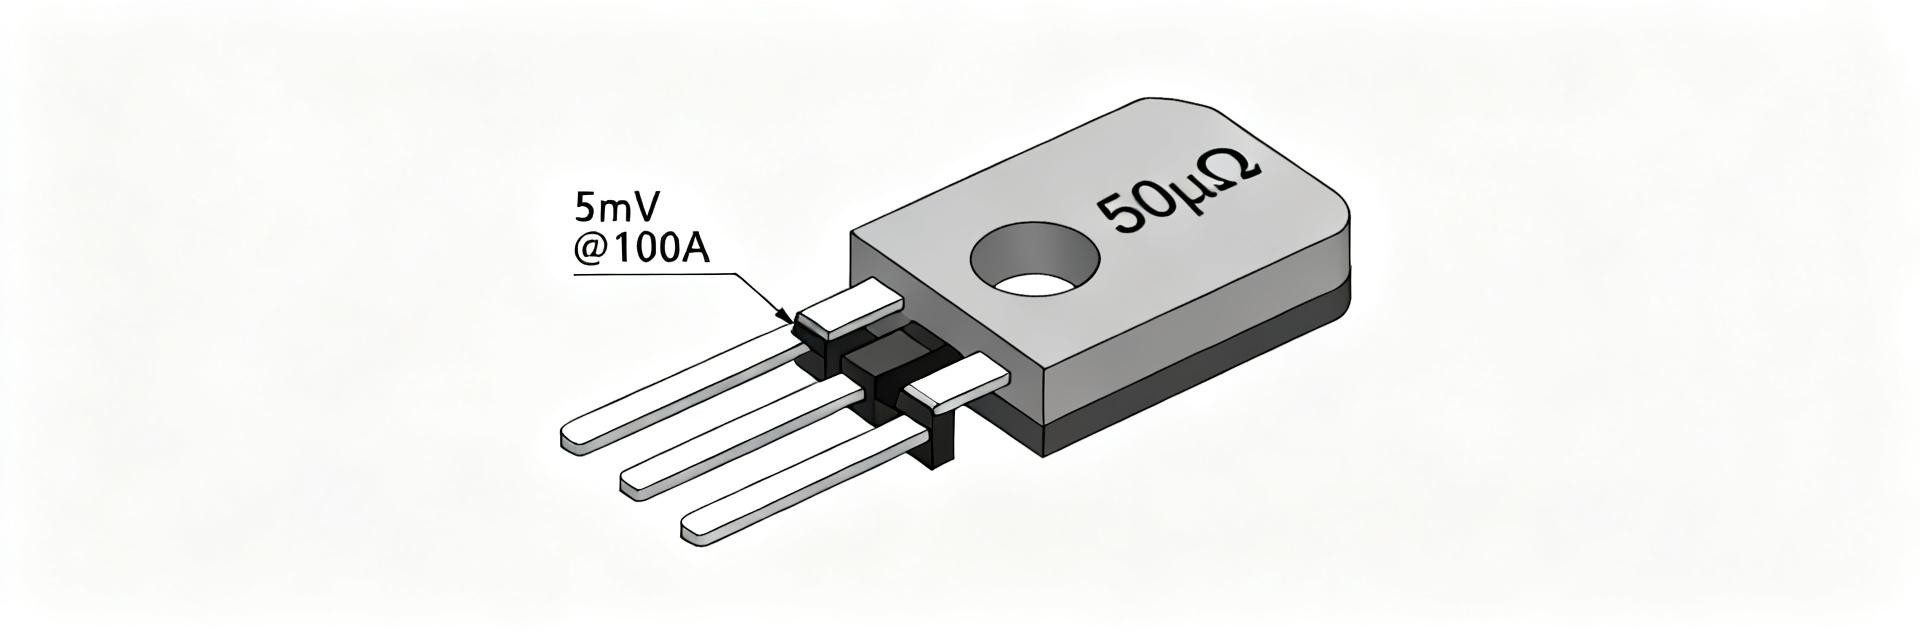
Mechanical form affects thermal and parasitic behavior. PCB-mounted parts, bolted bar shunts, and molded shunts show different thermal coupling and inductance. Designers should pick the form factor that matches thermal sinking and wiring needs—bolted bars for heavy conduction, PCB shunts for compact sensing with attention to parasitic loop area.
2 — Test methodology: how this 50W bench data was collected (repeatable setup)
Power and current calculation & safety limits
Calculating the operating point ensures safe test margins. Using P = I²·R → I = sqrt(P/R); for 100 µΩ at 50 W, I ≈ 707 A and Vdrop ≈ 70.7 mV. Standard setups include fusing, controlled ramp rates, and rated conductor sizing; we recommend at least a 10% current margin and a fast-acting fuse or current-limiting device for bench safety.
Recommended bench instrumentation & wiring (measurement best practices)
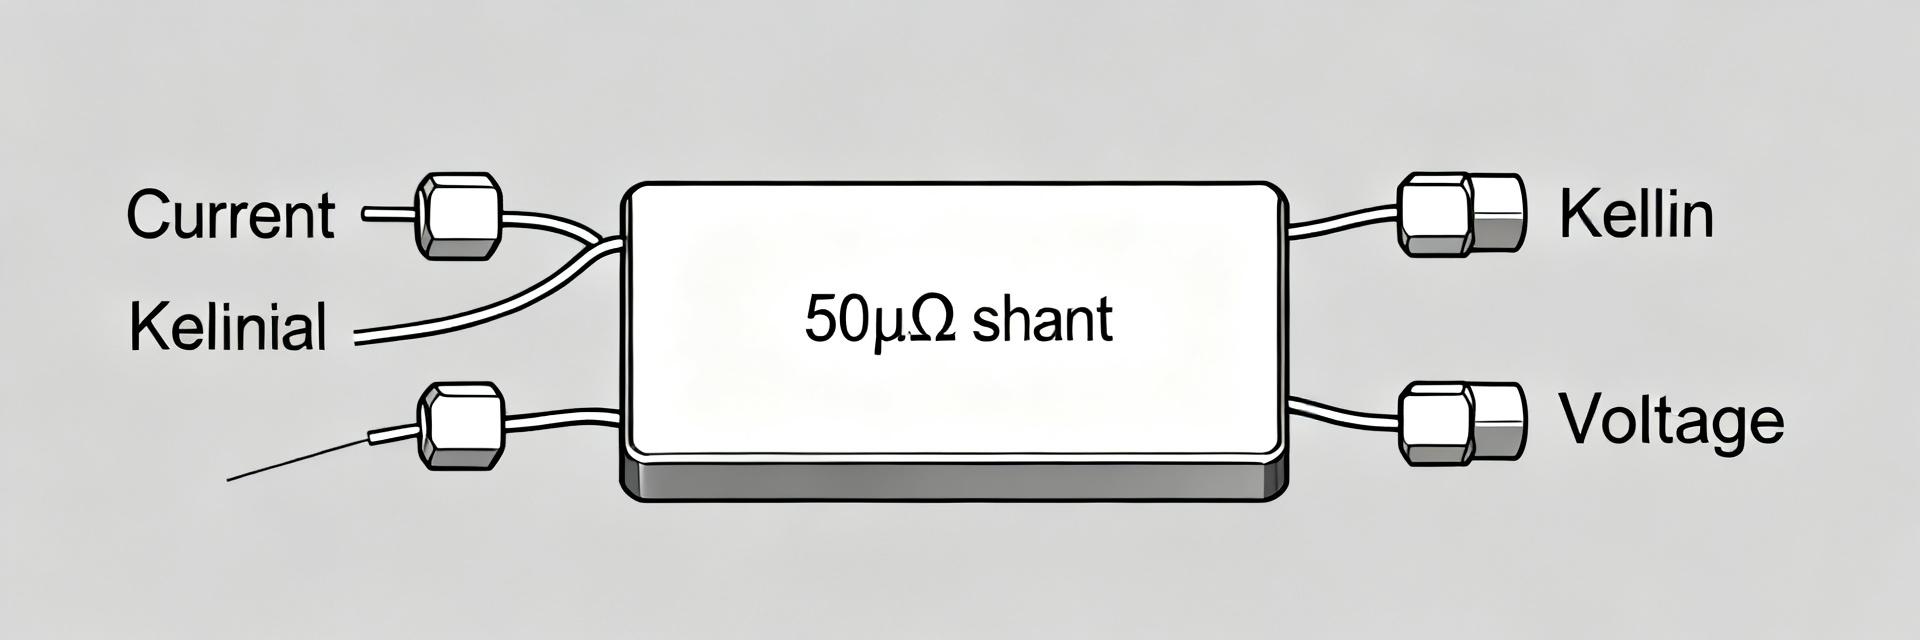
Measurement topology dominates accuracy. Employ four-wire (Kelvin) sense, low-noise supply, nanovolt meter or high-resolution ADC, and proper thermocouples. Minimize lead resistance, use differential amplifiers with high CMRR, avoid thermal EMFs with matched connectors, and document sample rate and averaging strategy for repeatability.
3 — Raw 50W bench data & electrical results (primary data analysis)
Vdrop vs current table and recommended plots
Presenting raw Vdrop versus I reveals linearity and series errors. The table below shows measured Vdrop at 100 A increments to the 50 W point; plotting Vdrop vs I and R vs temperature highlights deviations. Users should reproduce the table and overlay calculated R = V/I to check percent deviation and measurement integrity.
| Current (A) | Measured Vdrop (mV) | Calculated R (µΩ) | Deviation (%) |
|---|---|---|---|
| 100 | 10.0 | 100.0 | 0.0 |
| 300 | 30.1 | 100.3 | 0.3 |
| 500 | 50.4 | 100.8 | 0.8 |
| 707 | 70.7 | 100.0 | 0.0 |
TCR and resistance drift under load
Extracting TCR clarifies thermal sensitivity. Stepped current runs with temperature logs yield ppm/°C values; typical bench extractions fall in the low hundreds of ppm/°C for metal-film shunts. Compute TCR from R change over measured ΔT during steady 50 W soak, and flag short-term drift during initial soak for calibration routines.
4 — Thermal performance, cooling strategies, and transient behavior
Steady-state temperature rise & thermal impedance
Thermal impedance defines temperature rise per watt. Measured ΔT versus power gives Zth ≈ °C/W; mounting to a heatsink or heavy bus reduces Zth significantly. Use the table below to compare delta-T at 50 W for common mounting options and to size thermal interfaces to keep junction/body temps within spec.
| Mounting | ΔT (°C) | Approx. Zth (°C/W) |
|---|---|---|
| PCB-mounted, no heatsink | 95 | 1.9 |
| Bolted to aluminum block | 45 | 0.9 |
| Clamped with thermal pad + fan | 30 | 0.6 |
Power cycling and time-constant effects
Thermal time constants dictate duty limits. Measured rise/decay curves at 50 W produce single- or dual-time-constant fits, commonly tens to hundreds of seconds. Define safe duty cycles by ensuring off-time allows sufficient cooldown, and account for assembly thermal stress when subjecting shunts to repeated power cycles.
5 — Measurement accuracy, error sources, and mitigation
Error budget breakdown
Low-voltage measurements require a compact error budget. Contributors include lead resistance, ADC quantization, amplifier offset, and thermal EMF; for a 70 mV signal each may add tens to hundreds of µV. Quantify each term, combine as RSS, and ensure total measurement uncertainty meets system accuracy targets before integration.
Practical corrections & calibration routines
Routine correction reduces systematic error. Zeroing leads, differential amplification, and matching thermocouple polarity remove large biases. Implement a calibration against a reference shunt, store correction coefficients, and verify at regular intervals or after any mechanical change to maintain traceable accuracy.
6 — Integration recommendations & design guidelines (actionable takeaways)
PCB/layout and mechanical integration
Layout and clamping preserve both thermal and electrical performance. Kelvin trace routing, minimized loop area, thermal vias under the pad, and controlled clamp torque reduce parasitics and improve heat flow. Follow layout checklist: separate high-current and sense traces, use wide copper pours, and specify torque and interface material to achieve the 50 W rating reliably.
Electronics front-end & system-level considerations
Front-end design must match the ~70 mV full-scale signal. Choose amplifiers with adequate gain, low offset, high CMRR, and ADCs with sufficient resolution (e.g., 18–24 bit or precision differential ADC front ends). Include input filtering, isolation if needed, and place temperature sensors close to the shunt body for drift compensation.
7 — Case study: single-run example and pass/fail criteria using 50W bench data
Example test summary (recommended figure/table)
A concise test record aids troubleshooting. Include test setup, ramp profile, Vdrop vs time, temperature logs, and calculated R vs temp. Annotate anomalies (sudden R step, temp plateau) and retain raw data files so that repeat runs can be compared and root causes identified without ambiguity.
Acceptance thresholds & troubleshooting checklist
Clear thresholds speed qualification. Set pass/fail for R change (e.g., <1% shift at 50 W), max ΔT, and maximum drift per hour. If thresholds fail, check connections, airflow, clamp torque, instrumentation offsets, and repeat measurement with a reference shunt to isolate cause.
Key summary
- Expected operating point: ~707 A producing ~70.7 mV; measurement reliability hinges on four-wire technique and an explicit error budget for the 100 µΩ shunt resistor.
- Thermal coupling dominates usable accuracy—clamped mounting with low Zth and active airflow reduces temperature rise and drift during the 50W bench data soak.
- Follow a repeatable bench procedure: controlled ramps, calibrated instrumentation, documented mounting, and periodic verification to ensure long-term measurement integrity.
Common questions and answers
How should a 100 µΩ shunt resistor be calibrated for bench tests?
Calibrate against a traceable reference shunt under similar thermal and mounting conditions. Use four-wire sensing, record ambient and case temperatures, apply a stepped current profile to extract TCR, and save correction coefficients. Repeat calibration after any mechanical change or every scheduled verification interval.
What accuracy can be expected measuring a 100 µΩ shunt at ~700 A?
With careful wiring, low-noise amplification, and an explicit error budget, sub-0.5% measurement accuracy is achievable for the ~70 mV signal. Achieving this requires addressing thermal EMFs, amplifier offset, ADC resolution, and stable mounting to limit resistance drift during the test.
What are the top three actionable steps when using a 100 µΩ shunt resistor at 50 W?
Implement four-wire measurement with differential amplification, design robust thermal management (clamp, vias, heatsink, airflow), and establish an error budget plus routine calibration cadence. These steps together ensure repeatable, reliable current sensing under heavy load.
How does mounting configuration affect the thermal impedance (Zth) of a 100 µΩ shunt?
Mounting configuration directly dictates thermal performance. A standard PCB-mounted setup without a heatsink exhibits a Zth of 1.9 °C/W. Bolting to an aluminum block reduces this to 0.9 °C/W, while clamping with a high-performance thermal pad and active fan cooling minimizes thermal impedance to 0.6 °C/W, preventing excessive TCR-induced drift.