APT25GP120BSC15 Datasheet: Key Electrical & Thermal Stats
The opening technical decision for high‑voltage IGBT parts is whether the electrical ratings and thermal limits fit the target topology; the APT25GP120BSC15 appears as a 1200‑V class device with a nominal 25 A current profile. This piece extracts the datasheet items engineers must read first, explains how to turn graphs into numeric budgets, and highlights the thermal checks that gate prototype reliability.
All recommendations below assume reading the official datasheet for exact test conditions; the text uses sample numeric examples and conservative margins so designers can translate published curves into an initial thermal budget before hardware validation.
1 — Background: device role & package overview
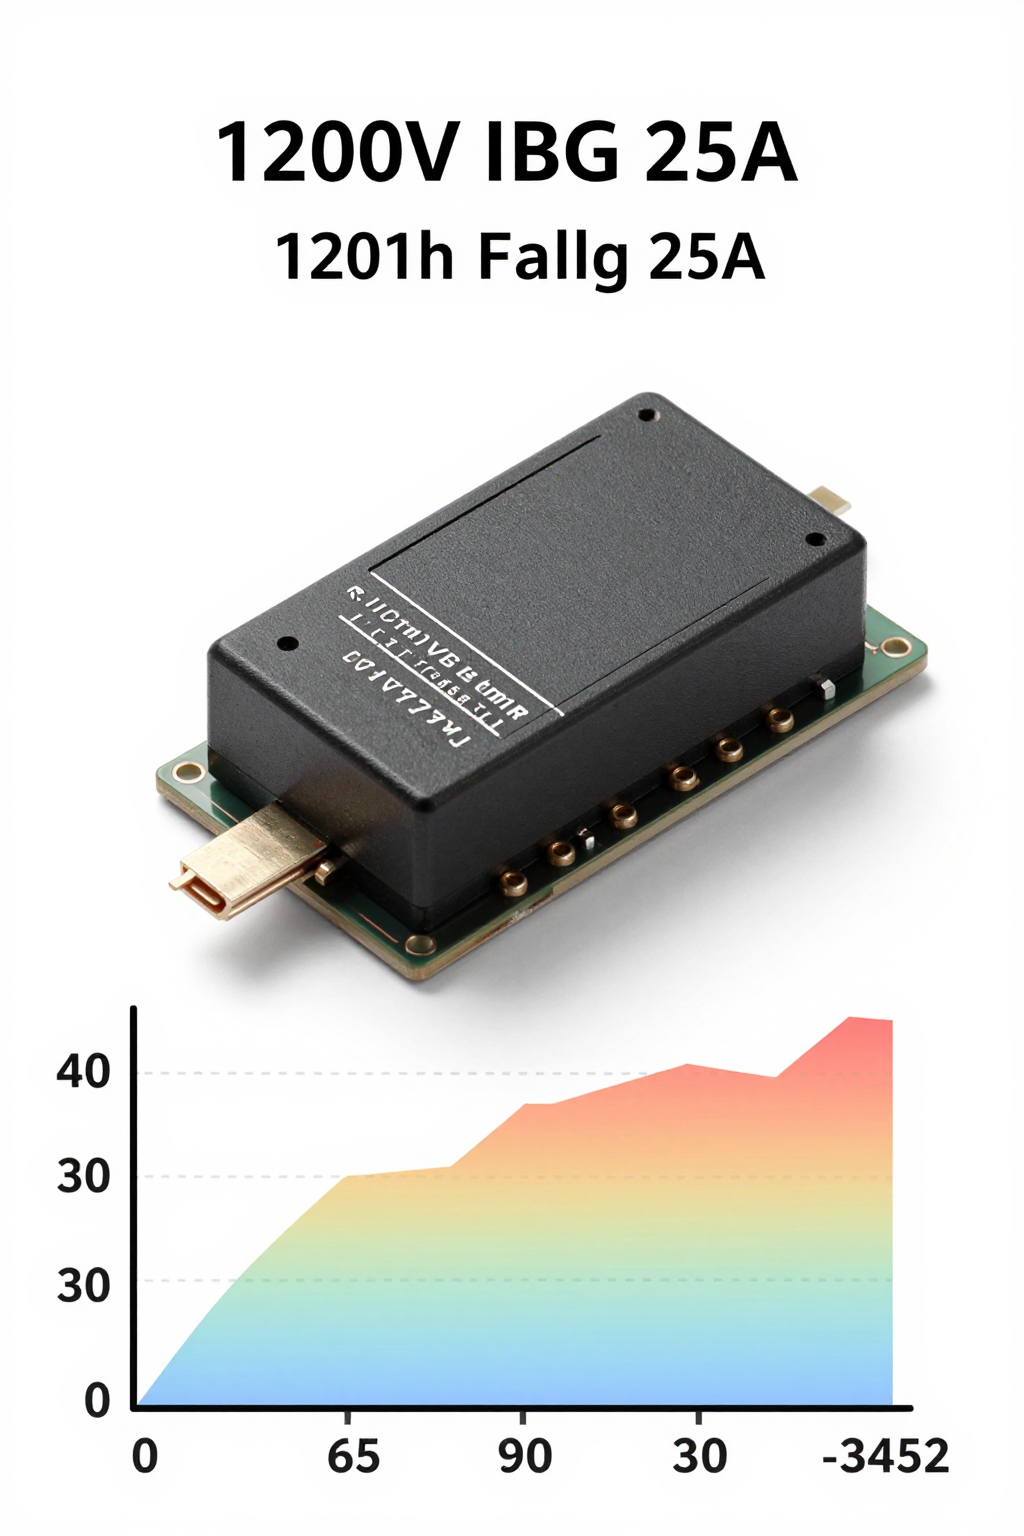
Point: Identify the device family and its target system roles. Evidence: The device is positioned as a high‑voltage IGBT/MOS‑family switch in the 25 A nominal class. Explanation: That current class makes it suitable for mid‑power SMPS stages, boost PFC, and inverter legs where 1200 V blocking is required; engineers should match device topology, switching speed, and thermal path to the application.
Device overview and intended applications
Point: Define where the part fits in a BOM. Evidence: Typical applications include PFC front‑ends, motor drive half‑bridges, and hard‑switching inverters. Explanation: For PFC and half‑bridge topologies, the device’s continuous and pulsed current specs set RMS and peak requirements that determine paralleling, snubber sizing, and gate‑driver capability.
Package outline and mechanical/thermal mounting notes
Point: Package choice controls thermal resistance and mounting constraints. Evidence: The datasheet lists a TO‑style power package with an exposed tab, standard mounting hole, and recommended torque and insulator notes. Explanation: Proper torque, thermal interface material, and insulation pads matter: they change junction‑to‑heatsink resistance and thus allowed steady‑state power before Tj limits are reached.
2 — APT25GP120BSC15: Key electrical specifications
| Parameter | Symbol | Min | Typ | Max | Unit |
|---|---|---|---|---|---|
| Collector-Emitter Voltage | VCES | - | - | 1200 | V |
| Continuous Collector Current | IC | - | 25 | - | A |
| Pulsed Collector Current | ICM | - | - | 75 | A |
| Gate-Emitter Threshold Voltage | VGE(th) | 4.0 | 5.5 | 7.0 | V |
| Total Gate Charge | QG | - | 120 | 150 | nC |
Point: Extract the core steady‑state ratings first. Evidence: Key fields are Vce (1200 V class), continuous collector current (25 A nominal), pulsed current, and maximum Pd under Tc test. Explanation: Use the datasheet’s Tc = 25°C ratings as a baseline and apply derating (for example, design to 80% of continuous current) to allow for elevated ambient and mounting uncertainty.
Static/steady-state ratings to extract and report
Point: Report voltage, current, and power limits with test conditions. Evidence: Record Vces (blocking), Ic continuous at specified Tc or Ta, pulsed current limits, and Pd at Tc. Explanation: List each with units and test temperature; then select a conservative operating point (e.g., 80% of Ic at the expected case temperature) to accommodate real‑world temperature rise and current sharing if paralleling.
Dynamic & switching parameters to measure design impact
Point: Dynamic parameters determine switching loss and gate‑drive needs. Evidence: Extract Vge(th), total gate charge Qg, Cies/Coss/Crss, and the timing/energy curves Eon/Eoff vs. Ic and Vce. Explanation: Use Qg to size driver peak current (Ig ≈ Qg × switching frequency) and combine Eon/Eoff curves with switching frequency to compute switching loss contribution to total Ploss.
3 — APT25GP120BSC15 Thermal performance & limits
Point: Thermal resistances and temperature limits are the gating design constraints. Evidence: Datasheet items include Rth(j‑c), Rth(j‑a) if provided, maximum Tj, and storage temperature range. Explanation: Use Rth values to convert device power dissipation into delta‑T via ΔT = P × Rth; compare Tj = Ta + ΔT (or use Tc baseline) against Tj(max) and apply derating for reliability.
Thermal resistances and maximum temperatures
Point: Distinguish junction, case, and ambient temperatures. Evidence: The datasheet lists Tj(max) and Rth values referenced to case or ambient test points. Explanation: For a given Ploss, compute ΔT(j‑c) and ΔT(c‑hs) separately; remember thermal interface and mounting resistance add to the heatsink requirement, so allocate a heatsink Rth budget accordingly.
Thermal derating curves and safe operating area (SOA) constraints
Point: Use SOA and derating curves to limit current and pulse duration. Evidence: Power vs. temperature and pulsed SOA boundaries are provided graphically. Explanation: Read the limiting curve at the planned Tcase or pulse duty; for example, convert per‑pulse switching energy into average switching loss, add conduction loss, and verify the combined thermal path keeps Tj below the derated maximum during worst‑case duty.
4 — How to interpret the datasheet: practical rules
Point: Convert plotted Eon/Eoff curves into numeric loss terms step‑by‑step. Evidence: Identify operating Vce, Ic, and switching frequency, then read energy per event from the plotted curves. Explanation: Compute Ploss = (Eon+Eoff)×f + Pcond; apply Rth_total to get ΔT and confirm Tj < Tj(max). Use 1.2–1.5× safety factor on energy values to cover measurement variance.
Converting graphs into numeric limits (step-by-step)
Point: Follow a replicable conversion procedure. Evidence: Steps: (1) pick operating V and I, (2) find Eon/Eoff at that point, (3) compute switching loss at f, (4) add conduction losses, (5) apply Rth. Explanation: A brief numeric example (sample numbers): if Eon+Eoff = 1.2 mJ at your operating point and f = 20 kHz, switching loss ≈ 24 W; add conduction loss (e.g., 10 W) → Ploss = 34 W; with Rth_total target 1.5°C/W → ΔT ≈ 51°C.
Understanding test conditions and conservative margins
Point: Vendor graphs assume controlled test setups. Evidence: Curves are often measured at Tc = 25°C or with ideal cooling. Explanation: Designers should apply conservative margins—reduce allowable current to 70–80% in elevated ambient, double‑check pulse widths relative to the SOA, and plan for transient events and thermal hotspots in assembly.
5 — Typical application considerations & topology notes
Point: Topology drives the dominant losses and protection choices. Evidence: In boost PFC the switch sees hard reverse recovery and high Vds stress; in half‑bridge inverter it sees bidirectional switching. Explanation: Choose gate resistance to balance dv/dt and switching loss, add RC snubbers or RC+diode clamps to tame Vce spikes, and specify transient suppression to protect against inductive ringing.
Gate-drive, snubber, and clamping recommendations
Point: Gate drive strength and snubber design limit switching stress. Evidence: Use Qg and Vge(th) to set gate drive voltage and peak source current; snubbers sized from measured spike energy. Explanation: Start with a gate drive that fully enhances the device at the desired Vge, add a small series gate resistor to damp oscillation, and implement an RC snubber where energy per spike exceeds the clamp ability.
Topology-specific thermal checks (PFC, half‑bridge, inverter)
Point: Each topology yields different RMS and peak currents. Evidence: PFC sees high RMS, inverter sees bidirectional pulses and switching repeats. Explanation: Measure case temperature at the tab for steady‑state, use thermal imaging for hotspots at solder joints, and verify SOA margins during rated pulse sequences; parallel devices require derating to ensure equitable current sharing.
6 — Thermal-management checklist and validation steps (actionable)
Point: Provide a compact calculation and test checklist. Evidence: Formulas: I_rms → Pcond, Ploss = (Eon+Eoff)·f + Pcond, ΔT = Ploss·Rth_total, Rth_heatsink = ΔT/Ploss − Rth_jc − Rth_mount. Explanation: Use consistent units (W, °C/W, A, V) and pick a ΔT that keeps Tj under Tj(max) with margin; allocate Rth among device, TIM, and heatsink.
Quick calculation checklist & formulas
Point: Step list for an initial thermal budget. Evidence: 1) compute I_rms and conduction loss; 2) read Eon/Eoff for operating V/I; 3) compute switching loss at f; 4) sum Ploss and calculate Rth_total target; 5) derive Rth_heatsink = Rth_total − Rth_jc − Rth_mount. Explanation: Apply a 20–30% safety margin and revisit once prototype measurements exist.
Prototype testing & measurement plan
Point: Validate with measurement under representative load. Evidence: Use thermal imaging, case thermocouple, and electrical monitoring during steady and pulsed loads. Explanation: Execute stepwise tests: low‑power functional, incremental power to steady‑state, pulsed SOA verification, and on‑board thermal cycling; pass criteria include Tj stay below derated limit and no SOA violations during the pulse envelope.
Summary
- The APT25GP120BSC15 datasheet gives the essential electrical ratings—1200 V blocking and a 25 A class current—that determine topology fit and initial selection for PFC, inverters, and SMPS.
- Extract static and dynamic parameters (Vce, Ic, Qg, Eon/Eoff, capacitances) and convert plotted energies into average switching loss to size gate drivers and estimate Ploss.
- Thermal design is the gating constraint: use Rth values to convert Ploss into ΔT, allocate Rth budget among device, TIM, and heatsink, and apply conservative derating for ambient and assembly variance.
- Before production, run prototype validation: thermal imaging, case thermocouple checks, and pulsed SOA tests with pass/fail criteria tied to Tj derating and current‑sharing margins.
Frequently Asked Questions
What are the key electrical limits for the APT25GP120BSC15?
The core limits are the 1200 V blocking rating, the continuous current class near 25 A, and specified pulsed current and maximum power dissipation at Tc. Engineers should extract Vce, Ic, pulsed ratings, and Pd with test temperatures from the datasheet to set conservative operating points.
How should I use the APT25GP120BSC15 datasheet to size a heatsink?
Compute total Ploss from switching and conduction terms, decide an acceptable ΔT relative to ambient and Tj(max), then calculate Rth_total = ΔT / Ploss. Subtract Rth_jc and Rth_mount to find the required heatsink Rth. Add margin for TIM and assembly variability.
What prototype tests should validate the APT25GP120BSC15 thermal plan?
Run steady‑state and pulsed load tests, use a thermocouple on the case and thermal imaging for hotspots, validate SOA pulses at worst‑case V and I, and confirm Tj remains below the derated limit. Check mounting torque and TIM performance as part of the validation checklist.
How do dynamic parameters like Qg affect gate driver selection?
Total gate charge (Qg) determines the peak current required by the gate driver. You must ensure the driver can supply Ig ≈ Qg × switching frequency without significant voltage drop, while also considering Ciss/Coss to manage dv/dt and di/dt stresses during hard-switching events.