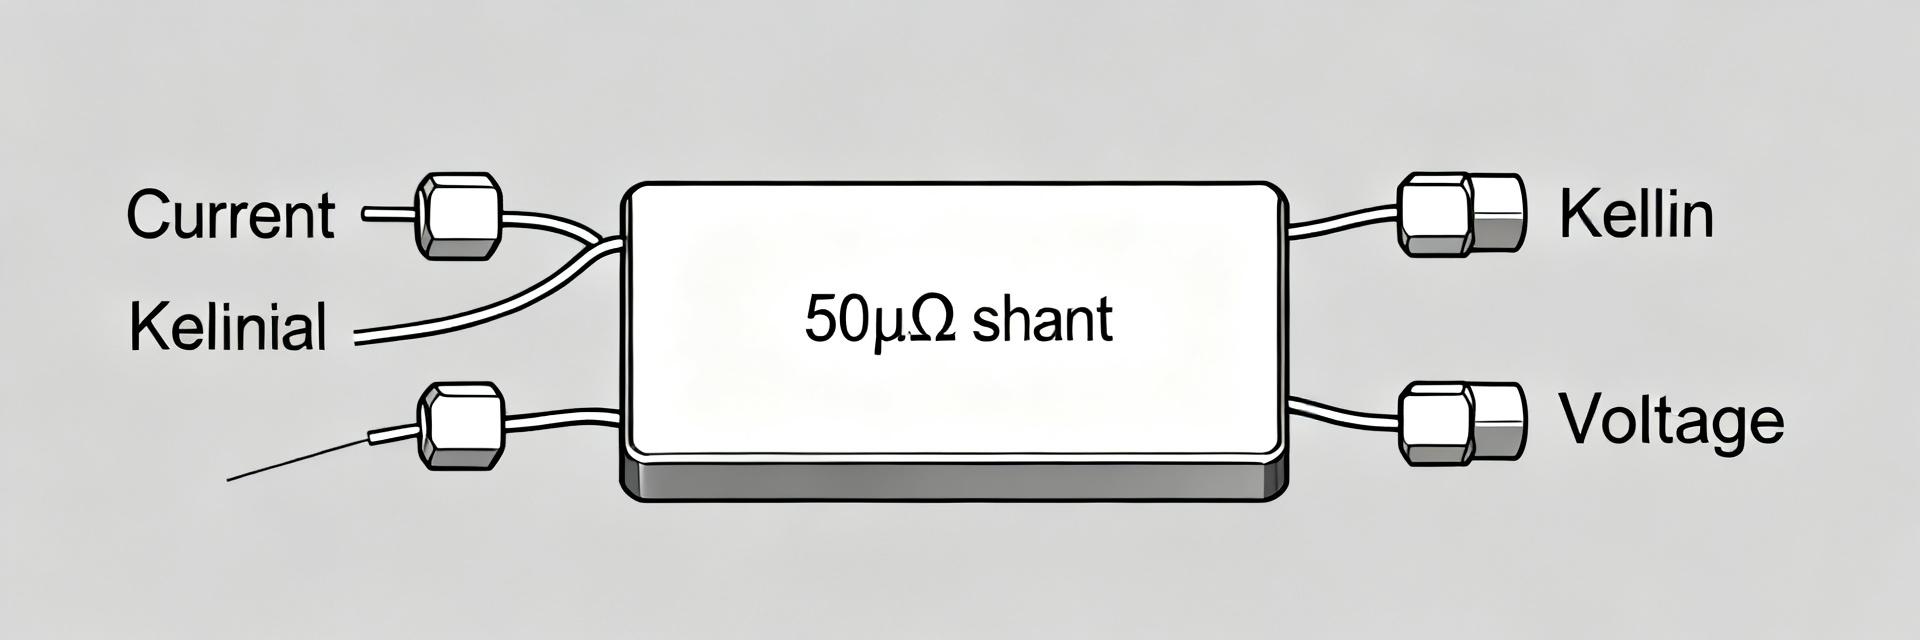
250 µΩ Shunt Resistor Datasheet: Performance & Specs
Point: Many low-ohm, high-current shunts are specified for millivolt-level drops and multi-watt dissipation; a 250 μΩ device routinely produces measurable tens of millivolts at hundreds of amps. Evidence: Typical industry figures show millivolt outputs at high currents and continuous dissipation ratings sized to limit temperature rise. Explanation: The 250 μΩ shunt resistor is valuable because it gives low insertion loss while producing a usable V = I×R signal for sense amplifiers; this article refers to the term "250 μΩ shunt resistor" to anchor datasheet interpretation and selection.
1 — Background: What is a 250 μΩ shunt resistor?
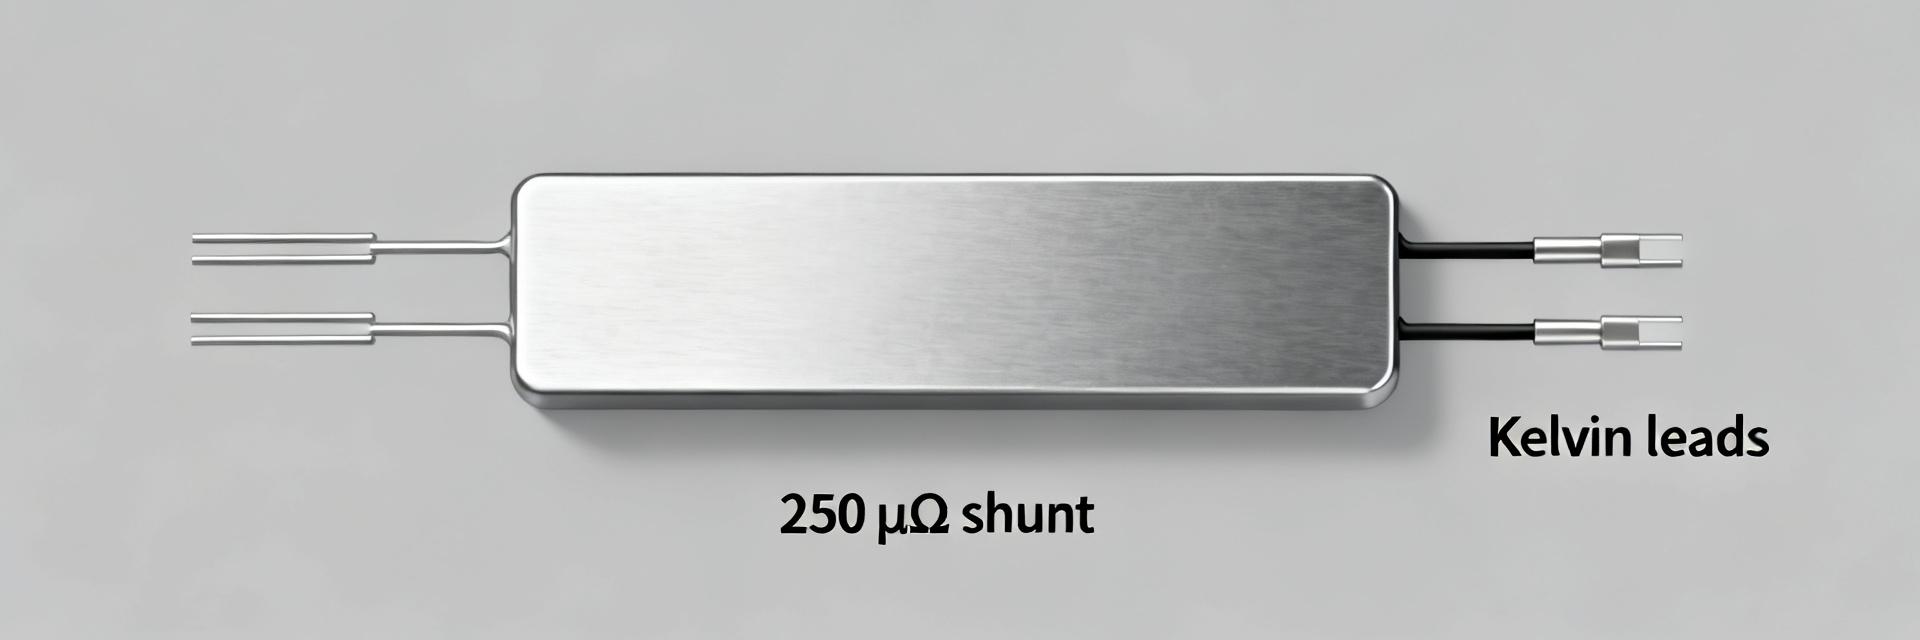
What a 250 μΩ shunt resistor is
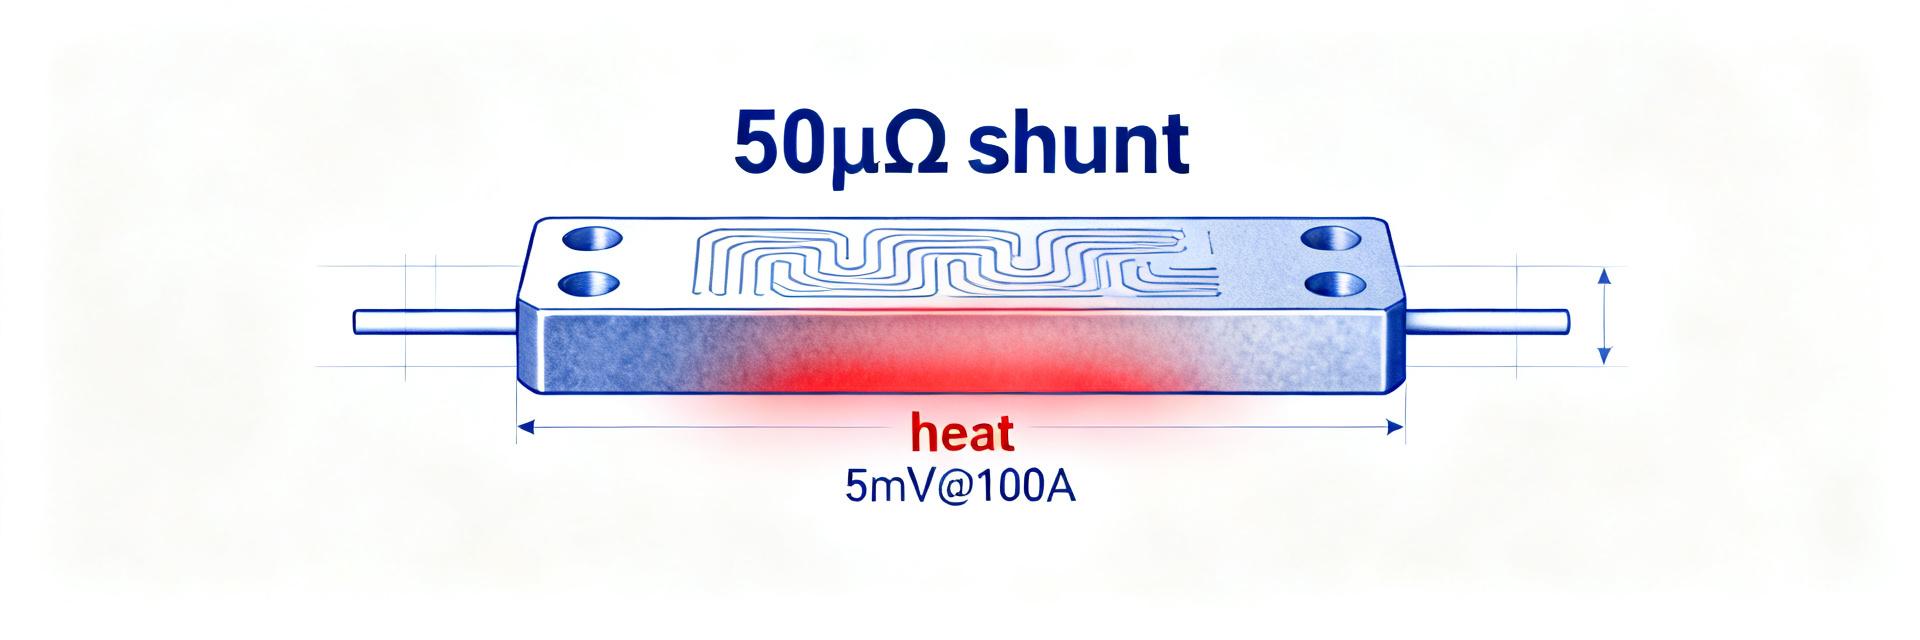
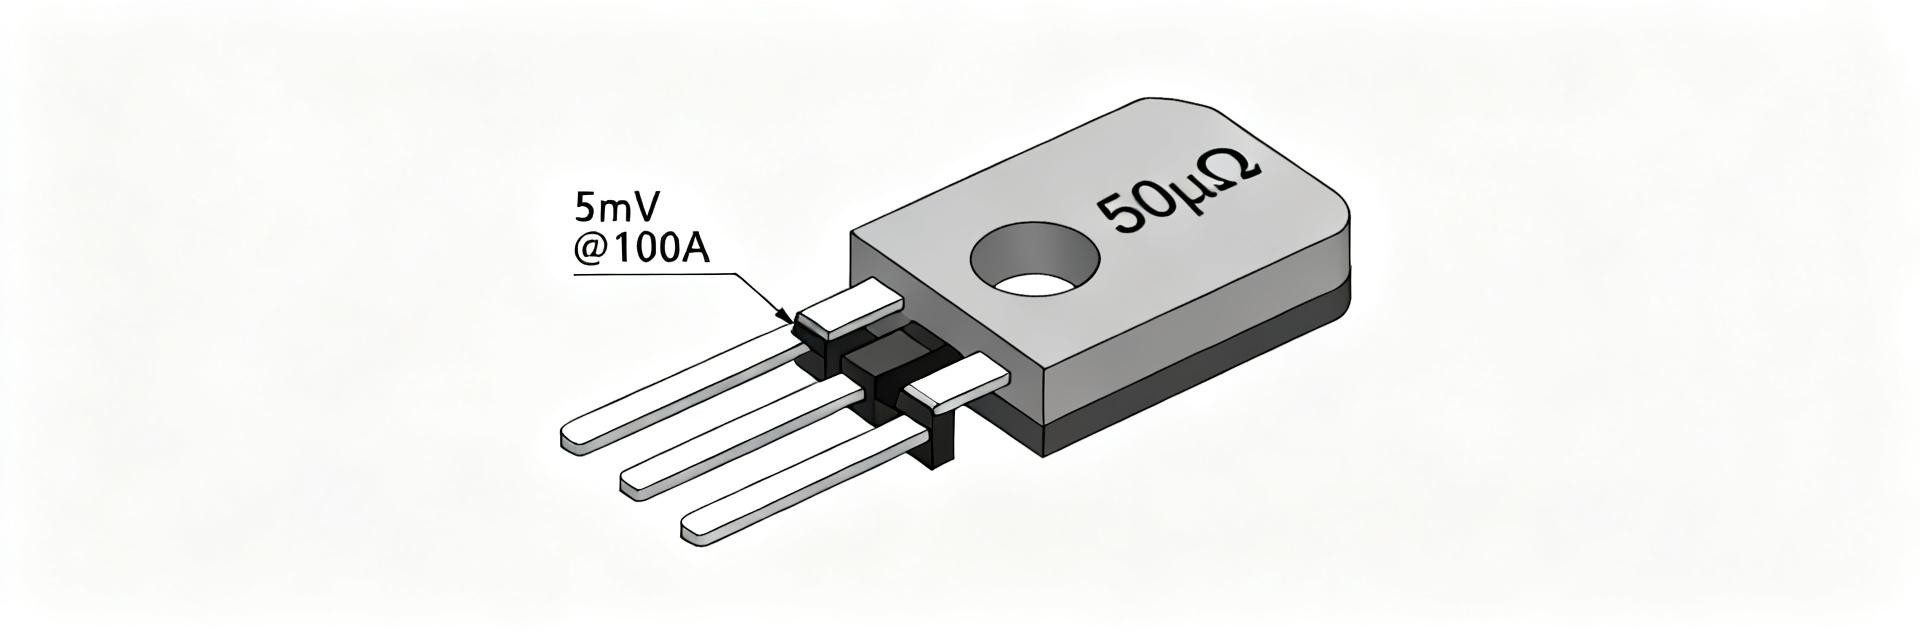
Point: A 250 μΩ (0.00025 Ω) shunt converts current to a small voltage via V = I×R. Evidence: At 100 A, V = 100×250e-6 = 0.025 V = 25 mV; P = I²×R = 100²×250e-6 = 2.5 W. Explanation: Use these formulas to predict sensing voltage and heat; low R keeps insertion loss low but requires sensitive measurement front-ends for millivolt-level signals.
Point: Quick reference conversions are essential. Evidence: Table below shows voltage drop and power loss for common currents. Explanation: Designers use this to size amplifiers, ADC ranges, and thermal management.
| Current (A) | Voltage Drop (mV) | Power Loss (W) |
|---|---|---|
| 50 | 12.5 | 0.625 |
| 100 | 25.0 | 2.500 |
| 200 | 50.0 | 10.000 |
| 500 | 125.0 | 62.500 |
Typical applications & why low resistance matters
Point: 250 μΩ shunts are common in battery management, motor control, energy storage and power conversion. Evidence: These applications need low insertion loss and precise current measurement across wide dynamic ranges. Explanation: Low R reduces power wasted in sensing and minimizes voltage drop across high-current paths, but it increases demands on amplifier resolution, CMRR, and wiring to avoid errors.
Point: Mounting styles affect performance. Evidence: Busbar, metal-strip and screw-terminal shunts offer different thermal and contact behavior. Explanation: Choose mounting that provides robust thermal path and low contact resistance while allowing Kelvin sensing where precision matters.
2 — Datasheet key parameters to expect
DC resistance, tolerance & temperature coefficient (TCR)
Point: DC resistance is listed as nominal ± tolerance, measured under specified conditions. Evidence: Datasheets often state R at 20°C with tolerance (e.g., ±1%). Explanation: TCR (ppm/°C) shifts resistance with temperature; compute R(T) = R0×[1 + (TCR×ΔT)/1e6]. Example: For 250 μΩ and TCR = 100 ppm/°C, a 50°C rise increases R by 1.25% → R≈253.1 μΩ.
Rated current, continuous power rating & voltage drop
Point: Continuous current rating is tied to allowable steady-state temperature and power. Evidence: Datasheets give continuous and short-time (pulse) ratings plus voltage drop at rated current. Explanation: Use voltage drop to size sense amplifiers (e.g., 25 mV at 100 A requires amplifier input range and ADC resolution that can resolve target error budgets); derate parts for elevated ambient or constrained thermal paths.
3 — Electrical & thermal performance deep-dive
Power dissipation, thermal resistance & derating curves
Point: Thermal behavior governs continuous rating; look for derating vs ambient curves. Evidence: Shunts specify power vs ambient temperature and thermal time-constants. Explanation: Read thermal resistance as ΔT per watt; a simple model: ΔT = P×Rth(ambient). Designers extract allowed P at a target ambient to avoid overheating and ensure long-term stability.
Resistance stability, drift & long-term accuracy
Point: Stability is affected by self-heating, mechanical stress and material drift. Evidence: Datasheets show short-term drift (self-heating) and long-term stability test data. Explanation: Use 4-wire (Kelvin) measurement to remove lead/contact errors; accept drift targets in ppm over required lifetime for precision systems.
4 — How to read & interpret a 250 μΩ shunt resistor datasheet
Interpreting mechanical drawings & mounting notes
Point: Mechanical data affect electrical contacts and thermal path. Evidence: Drawings list footprint, hole sizes, torque and plating. Explanation: Follow recommended torque and plating notes to minimize contact resistance; mark Kelvin sense locations and maintain clearances to avoid stray conduction paths.
Using electrical graphs: V–I, derating & transient behavior
Point: V–I linearity and transient pulse graphs are key to worst-case limits. Evidence: Datasheets show V–I linear curves and pulse power vs duration. Explanation: Extract worst-case voltage drop from V–I and compute thermal response for pulses using given time-constants; example worked box below illustrates a steady + pulse profile.
Worked Calculation: 100 A steady + 500 A, 0.5 s pulse
- Steady State: V = 25 mV, P = 2.5 W.
- Pulse State: V = 125 mV, instantaneous P = 62.5 W.
- Action: Verify the thermal time constant against the datasheet pulse energy curve to ensure transient junction temperature does not breach absolute limits.
5 — Mounting, measurement & test best practices
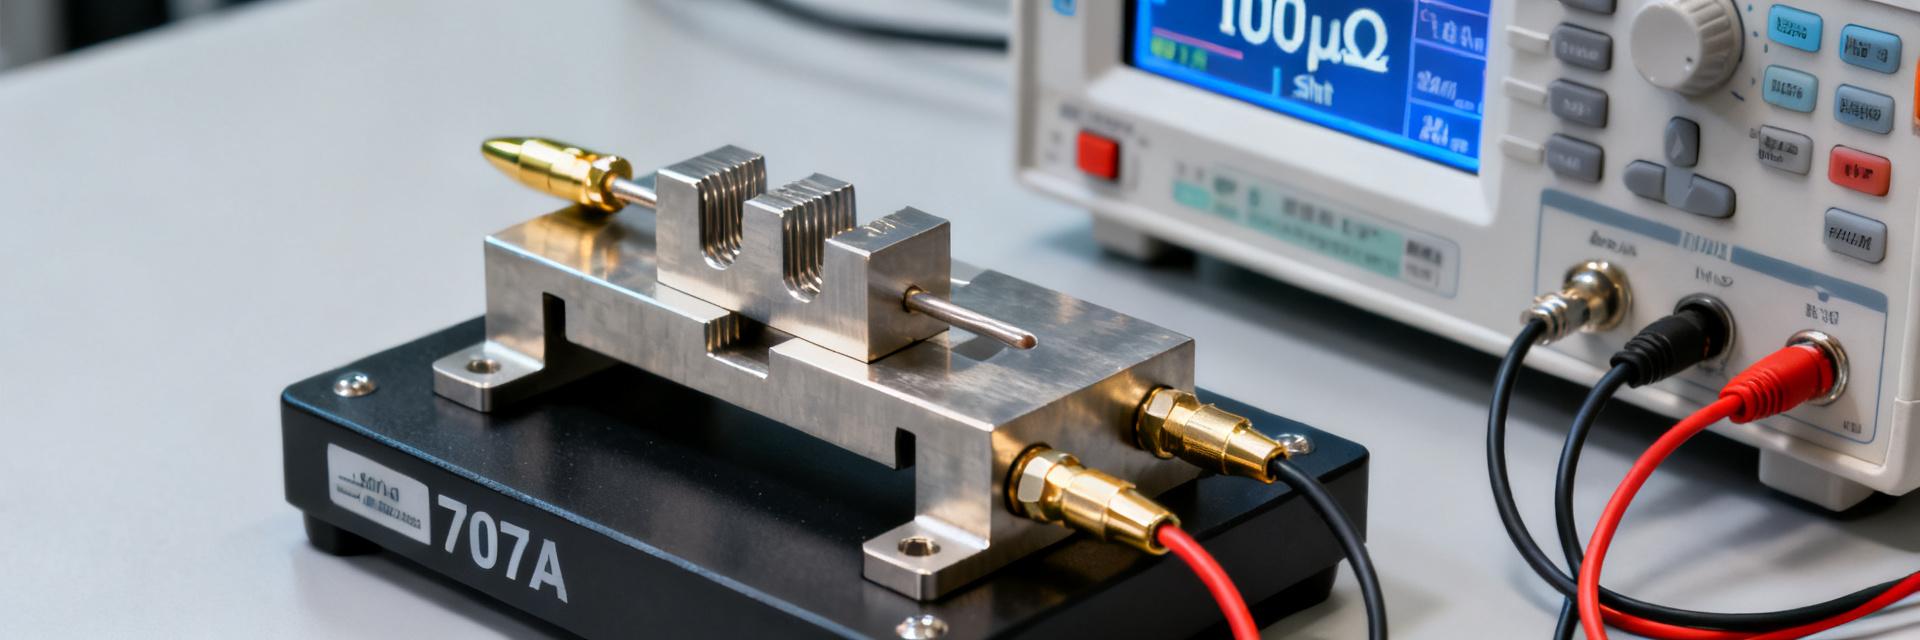
Measurement circuit and wiring (Kelvin sense, sense amplifiers)
Point: Kelvin wiring eliminates series contact error and noise. Evidence: Four-wire layouts and twisted Kelvin leads reduce loop area and common-mode pickup. Explanation: Select sense amplifier input range near expected millivolts (e.g., 0–100 mV) and ensure ADC resolution meets error budget; include filtering to reduce switching noise without distorting pulses.
Mechanical mounting, torque, and thermal path management
Point: Mechanical and thermal installation determine real-world dissipation. Evidence: Torque, plating and chassis conduction change thermal resistance. Explanation: Validate with thermocouples or IR imaging at critical points; perform step and soak tests to confirm that the shunt meets derated continuous ratings and does not enter thermal runaway.
6 — Selection checklist & real-world application examples
Step-by-step selection checklist
- Required continuous and peak current: Include safety margin (e.g., ≥1.25× continuous current).
- Acceptable voltage drop: Confirm amplifier input range and ADC resolution.
- Power rating & derating curves: Check ambient temperature and physical mounting conditions.
- Tolerance & TCR: Ensure target accuracy is maintained across the design's temperature swing.
- Mechanical fit: Verify mounting method, terminal dimensions, and Kelvin sense interface.
- Expected lifetime/stability: Cross-check specified drift (ppm/year) against your system calibration intervals.
Example application scenarios with calculations
Point: Practical examples show selection tradeoffs. Evidence: For a 12 V battery pack with 150 A steady draw, V=150×250e-6=37.5 mV, P=5.625 W; choose shunt with continuous rating >7 W (derated) and amplifier input for ~40 mV full scale. Explanation: For motor inrush, compare pulse energy to datasheet pulse curve; for telecom/UPS, derate for elevated ambient to ensure long-term stability.
Summary
- Use the equations V = I×R and P = I²×R to compute expected voltage and heating when evaluating a 250 μΩ shunt resistor; validate that sense amplifier and ADC can resolve the millivolt outputs.
- Check TCR and tolerance to ensure accuracy across expected temperature ranges and apply derating from the datasheet for elevated ambient or constrained thermal paths.
- Prefer Kelvin (4‑wire) measurement and follow mounting torque/finish notes to minimize contact errors; validate thermal performance with soak/pulse testing.
FAQ
What measurement accuracy can I expect from a 250 μΩ shunt resistor?
Accuracy depends on tolerance, TCR, wiring and amplifier resolution. With a ±1% shunt tolerance and good Kelvin wiring, practical system-level accuracy in the 0.1–1% range is achievable; reduce error by choosing low-TCR materials and calibrating across temperature.
How do I size the sense amplifier for a 250 μΩ shunt resistor?
Pick an amplifier whose input range comfortably covers the expected millivolt output (e.g., 0–50 mV or 0–200 mV) and whose offset/noise are small relative to the smallest measurable signal; include headroom for pulses and offset calibration.
How should I validate the datasheet ratings for a 250 μΩ shunt resistor?
Perform step and soak tests at target ambient and mounting, measure temperature at the shunt, and run representative pulse cycles. Compare measured ΔT per watt to datasheet curves and confirm continuous power limits with thermocouple and IR checks.
Why does low resistance matter for a 250 μΩ shunt?
Low resistance reduces insertion loss and power wasted as heat in high-current paths. However, it requires highly sensitive analog front-ends with high common-mode rejection to handle the resulting millivolt-level signals accurately.