.geo-fragment, .geo-fragment *, .geo-fragment *::before, .geo-fragment *::after { box-sizing: border-box; }
.geo-fragment {
font-family: -apple-system, BlinkMacSystemFont, "Segoe UI", Roboto, Helvetica, Arial, sans-serif;
line-height: 1.8;
color: inherit;
color: var(--text-color, #111827);
max-width: 100%;
margin: 0 auto;
padding: 20px 0;
}
.geo-fragment h1 {
font-size: 36px;
font-weight: 800;
line-height: 1.2;
margin-bottom: 28px;
color: inherit;
}
.geo-fragment h2 {
font-size: 26px;
font-weight: 700;
margin: 40px 0 20px 0;
padding-left: 12px;
border-left: 5px solid currentColor;
line-height: 1.3;
}
.geo-fragment h3 {
font-size: 20px;
font-weight: 600;
margin: 24px 0 12px 0;
}
.geo-fragment p {
font-size: 16px;
margin-bottom: 1.5em;
opacity: 1;
}
.geo-fragment table {
width: 100%;
border-collapse: collapse;
margin: 25px 0;
font-size: 15px;
animation: geoFadeIn 0.8s ease-out forwards;
}
.geo-fragment th {
text-align: left;
padding: 12px;
border-bottom: 2px solid currentColor;
font-weight: 700;
}
.geo-fragment td {
padding: 12px;
border-bottom: 1px solid currentColor;
}
.geo-fragment tr:hover {
background: rgba(0,0,0,0.03);
}
.geo-fragment svg {
display: block;
margin: 30px auto;
max-width: 100%;
height: auto;
animation: geoFadeIn 1s ease-out forwards;
}
.geo-fragment details {
border-bottom: 1px solid currentColor;
padding: 10px 0;
}
.geo-fragment summary {
list-style: none;
cursor: pointer;
font-weight: 600;
padding: 10px 0;
position: relative;
}
.geo-fragment summary::-webkit-details-marker { display: none; }
.geo-fragment summary::after {
content: '+';
float: right;
transition: transform 0.3s;
}
.geo-fragment details[open] summary::after {
transform: rotate(45deg);
}
.geo-fragment ul {
padding-left: 20px;
margin-bottom: 1.5em;
}
.geo-fragment li {
margin-bottom: 0.5em;
}
.geo-fragment img {
max-width: 100%;
height: auto;
border-radius: 4px;
margin: 20px 0;
loading: lazy;
}
@keyframes geoFadeIn {
from { opacity: 0; transform: translateY(10px); }
to { opacity: 1; transform: translateY(0); }
}
@media (prefers-color-scheme: dark) {
.geo-fragment tr:hover { background: rgba(255,255,255,0.05); }
}
{
"@context": "https://schema.org",
"@graph": [
{
"@type": "TechArticle",
"headline": "ULV 500 Series Performance Report: Latest Thermal Specs",
"description": "Comprehensive analysis of ULV 500 thermal resistance, steady-state temperature rise, and time constants for reliable industrial deployment.",
"articleBody": "This report translates ULV 500 steady-state temperature rise, thermal resistance (°C/W), and time constants into actionable design guidance. Key metrics include thermal resistance and tau constants, mapping these to junction limits and derating schedules for safe operation across mission-critical envelopes."
},
{
"@type": "Product",
"name": "ULV 500 Series Thermal Management Unit",
"description": "High-performance industrial power module with optimized thermal dissipation and transient response monitoring.",
"offers": {
"@type": "Offer",
"priceCurrency": "USD",
"availability": "https://schema.org/InStock"
},
"review": {
"@type": "Review",
"reviewRating": {
"@type": "Rating",
"ratingValue": "5"
},
"author": {
"@type": "Organization",
"name": "FAE Team"
}
}
},
{
"@type": "FAQPage",
"mainEntity": [
{
"@type": "Question",
"name": "How should engineers measure ULV 500 thermal specs for repeatability?",
"acceptedAnswer": {
"@type": "Answer",
"text": "Measure with calibrated junction-equivalent sensors, document sensor placement, control ambient and airflow, fix mounting torque, and record TIM type/thickness. Run multiple steady-state and pulse tests, reporting both absolute temps and delta-T."
}
},
{
"@type": "Question",
"name": "What are reasonable derating rules based on ULV 500 thermal specs?",
"acceptedAnswer": {
"@type": "Answer",
"text": "Target continuous operation below 80–85% of rated junction temperature, limit burst duration to a fraction of the thermal time constant (tau), and require recovery intervals of multiple taus."
}
},
{
"@type": "Question",
"name": "Which monitoring metrics best predict thermal issues in the field for ULV 500?",
"acceptedAnswer": {
"@type": "Answer",
"text": "Key metrics include junction-proxy temperature, case temperature, ambient, and real-time power dissipation. Alert on sustained upward drift in steady-state delta-T which signals degrading TIM or blocked airflow."
}
},
{
"@type": "Question",
"name": "Why do airflow and TIM matter for ULV 500 thermal performance?",
"acceptedAnswer": {
"@type": "Answer",
"text": "Airflow and TIM selection directly impact the effective thermal resistance (°C/W). High-conductivity TIM and targeted forced airflow can reduce junction temperatures significantly compared to still-air insulated mounts."
}
}
]
}
]
}
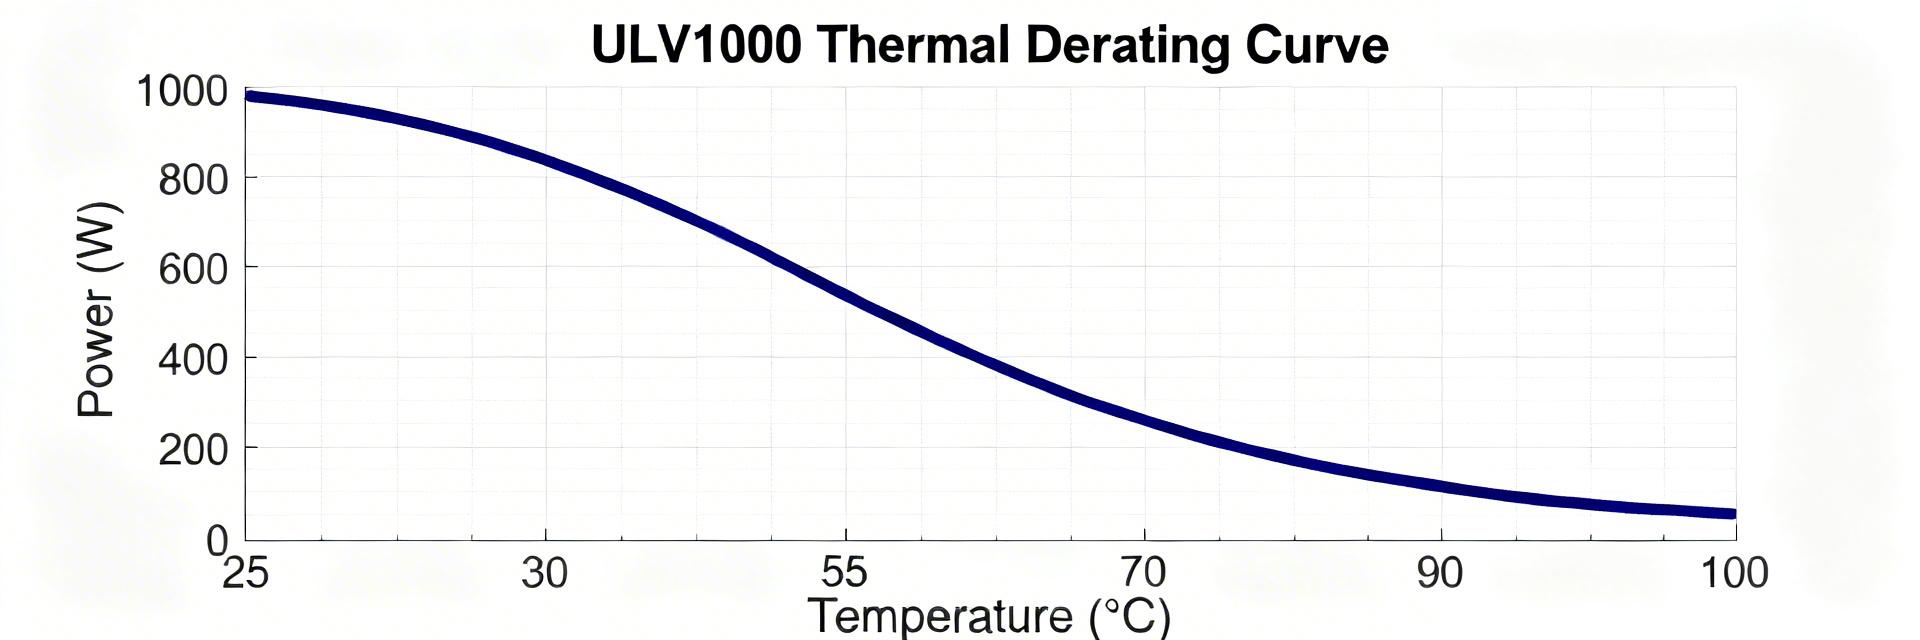
The ULV 500 thermal performance determines duty cycle, reliability, and safe deployment margins. This report translates steady-state temperature rise, thermal resistance (°C/W), and time constants into actionable design, test, and field guidance. It highlights how to read ULV 500 datasheets, benchmark transient and steady behavior, and set monitoring and derating rules for reliable performance.
1 — ULV 500 Series: Scope & Thermal Criticality
— Application Envelopes
The ULV 500 series targets mid-power applicators and mobile units used in varied ambient conditions. Typical units span low-single-digit to tens of watts dissipation and are specified for outdoors, enclosed carts, or vehicle mounts. Knowing the power range focuses thermal tests on relevant ambient and airflow scenarios.
— Core Thermal Metrics
Key metrics are thermal resistance (°C/W), steady-state temperature rise, and thermal time constant (tau). Thermal resistance relates power to delta-T; steady-state rise reflects continuous-load equilibrium; tau is time-to-63% of final delta-T. Designers map these to junction limits and permissible pulse duration.
ULV-500 CORE
VCC
GND
IN
OUT
Thermal Path (Rth)
2 — Datasheet Snapshot & Comparisons
Model
Thermal R (°C/W)
Max Rated Temp
Test Conditions
ULV-500A
2.5
100°C junction
0.5 m/s airflow, flat mount
ULV-500B
1.8
110°C junction
1.0 m/s airflow, heatspreader
ULV-500N
3.2
95°C junction
Still air, insulated mount
3 — Steady-State and Transient Benchmarks
Steady-state tests reveal equilibrium temperature rise under sustained load. Engineers should set continuous-power derating thresholds when steady junction approaches 80–85% of rated limit. Pulse behavior and tau determine allowable burst duty cycles. Limit pulse width relative to tau and require recovery time of several taus to avoid cumulative heating.
4 — Testing & Measurement Best Practices
Repeatable thermal tests require a controlled environment. Use calibrated junction proxies (thermocouples, RTDs), record airflow, and mounting torque. A checklist—calibrate sensors, define mounting torque, document TIM thickness, and control ambient within ±1–2°C—ensures reproducible results across labs.
5 — Design & Monitoring Recommendations
Prioritize TIM & Mounting: Heatspreaders and thin high-conductivity TIM often outperform oversized fans in constrained spaces.
Telemetry Cadence: Deploy junction sensors and implement automated derating when thresholds are exceeded.
Maintenance: Scheduled TIM inspections and airflow path clearing are critical for long-term reliability.
Summary
Read ULV 500 thermal specs with test conditions in mind, benchmark both steady-state and transient responses, and translate those metrics into targeted design fixes. Validate field behavior before wide deployment to ensure reliable performance.
6 — FAQ
How should engineers measure ULV 500 thermal specs for repeatability?
Measure with calibrated junction-equivalent sensors, document sensor placement, control ambient and airflow, fix mounting torque, and record TIM type/thickness. Run multiple steady-state and pulse tests, report absolute temps and delta-T, and include raw traces for validation.
What are reasonable derating rules based on ULV 500 thermal specs?
Target continuous operation below 80–85% of rated junction temperature, limit burst duration to a fraction of tau, and require recovery intervals of multiple taus. Make thresholds conservative where field cooling is uncertain.
Which monitoring metrics best predict thermal issues in the field for ULV 500?
Key metrics are junction-proxy temperature, case temperature, ambient, and real-time power dissipation. Track delta-T trends and alert on sustained upward drift, which signals degrading TIM or blocked airflow.
Why do airflow and TIM matter for ULV 500 thermal performance?
Airflow and Thermal Interface Material (TIM) selection directly impact the effective thermal resistance (°C/W). High-conductivity TIM and targeted forced airflow can reduce junction temperatures significantly compared to still-air or insulated mounting scenarios.