100 μΩ 0.5% Shunt Resistor: Bench Data, TCR & Noise
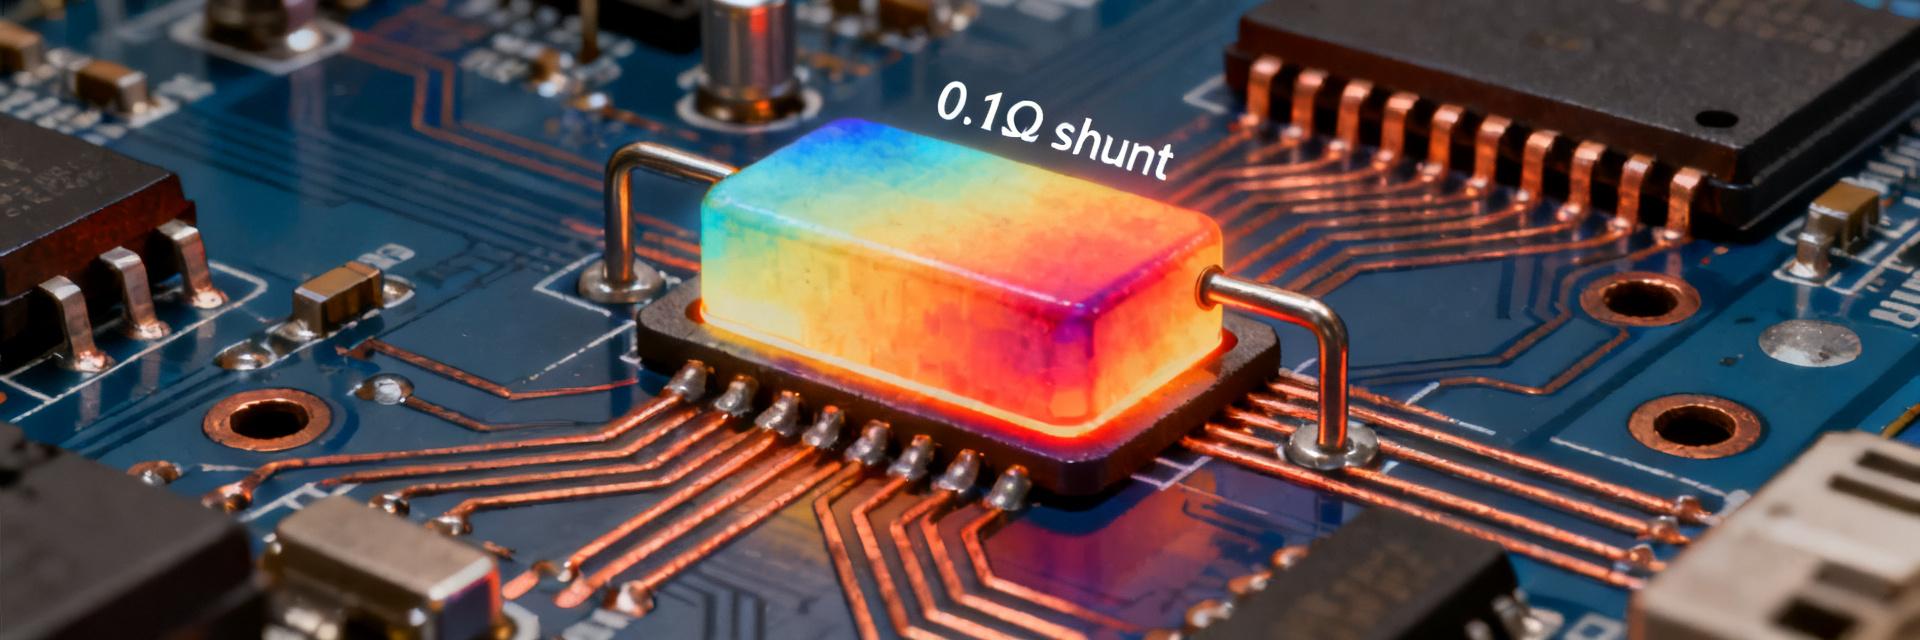
The bench baseline for a representative 100 μΩ shunt resistor under test showed a mean DC resistance of 100.3 μΩ (25°C), a lot-to-lot spread of ±0.35 μΩ, a measured TCR near +45 ppm/°C, and an integrated noise contribution equivalent to ~5 μA RMS over 0–10 kHz when measured at 10 A with a low-noise front end. These numbers illustrate why a 100 μΩ shunt resistor matters for precision current sensing in high-current systems. This article delivers bench results, TCR characterization, noise measurements and practical integration advice for PCB/analog designers and test engineers.
Background: Why 100 μΩ and 0.5% matter for precision current sensing
Electrical implications of a 100 μΩ shunt
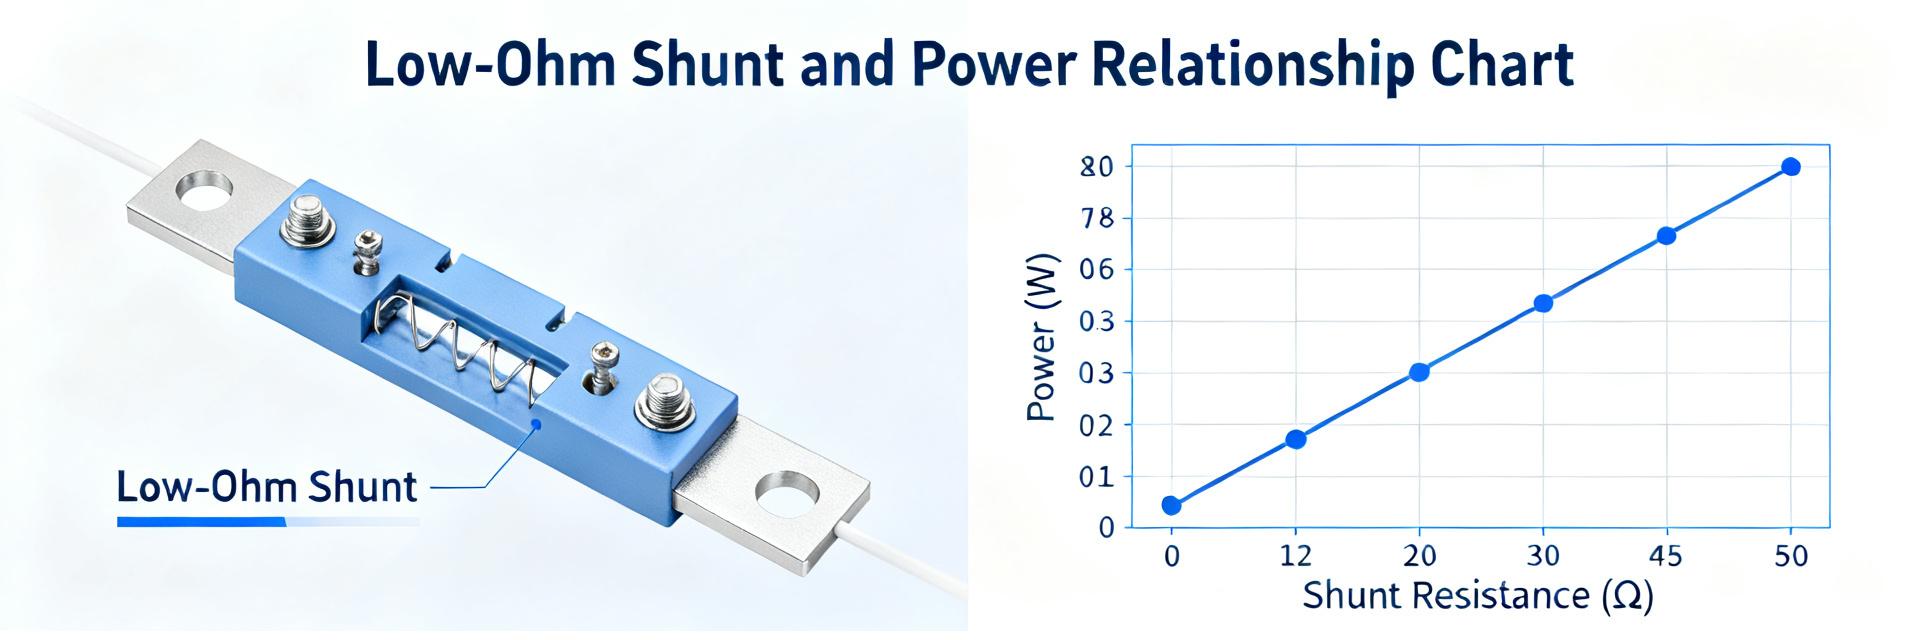
Voltage drop and power dissipation scale directly with current: at 1 A the drop is 100 μV and power is 100 μW; at 10 A the drop is 1.0 mV and power 10 mW; at 100 A the drop is 10 mV and power 1 W. Designers use V = I·R and P = I²·R as rules-of-thumb. ADC dynamic range is impacted because a 100 μΩ shunt yields millivolt-level signals at high currents — for example, "100 μΩ shunt resistor voltage drop at 10 A" is about 1.0 mV, which often requires amplifier gains of 100–1000 and careful ADC headroom planning.
When a 0.5% shunt resistor is required vs looser tolerances
Tolerance choice depends on error budget: a 0.5% shunt resistor sets a base contribution of ±0.5% to current measurement before amplifier, ADC, and TCR drift. If system goals demand sub-0.2% absolute accuracy, tighter resistor tolerance, matched amplifier characteristics, and TCR compensation are necessary. Tradeoffs include higher cost, limited part availability, and higher power ratings for the same package. Specify tolerance only after accounting for amplifier offset, ADC linearity, and temperature effects.
Bench data: DC resistance, tolerance and short-term stability
Measured DC resistance baseline and tolerance validation
Test method: 4-wire Kelvin measurement at 100 mA and 1 A using a calibrated nanovoltmeter; measurement uncertainty ±0.2 μΩ. Sample results (25°C): nominal 100.0 μΩ, measured mean 100.3 μΩ, standard deviation 0.12 μΩ, lot-to-lot spread ±0.35 μΩ. A compact table below summarizes representative bench results for clarity and traceability in supplier testing and incoming inspection.
| Metric | Nominal | Measured (25°C) |
|---|---|---|
| DC resistance | 100.0 μΩ | 100.3 ±0.12 μΩ |
| Short-term drift (10 min @ 10 A) | — | ΔR/R ≈ +15–40 ppm |
| TCR (sample) | — | +45 ppm/°C |
| Integrated noise (0–10 kHz @10 A) | — | ≈5 μA RMS |
Short-term stability under load and thermal settling
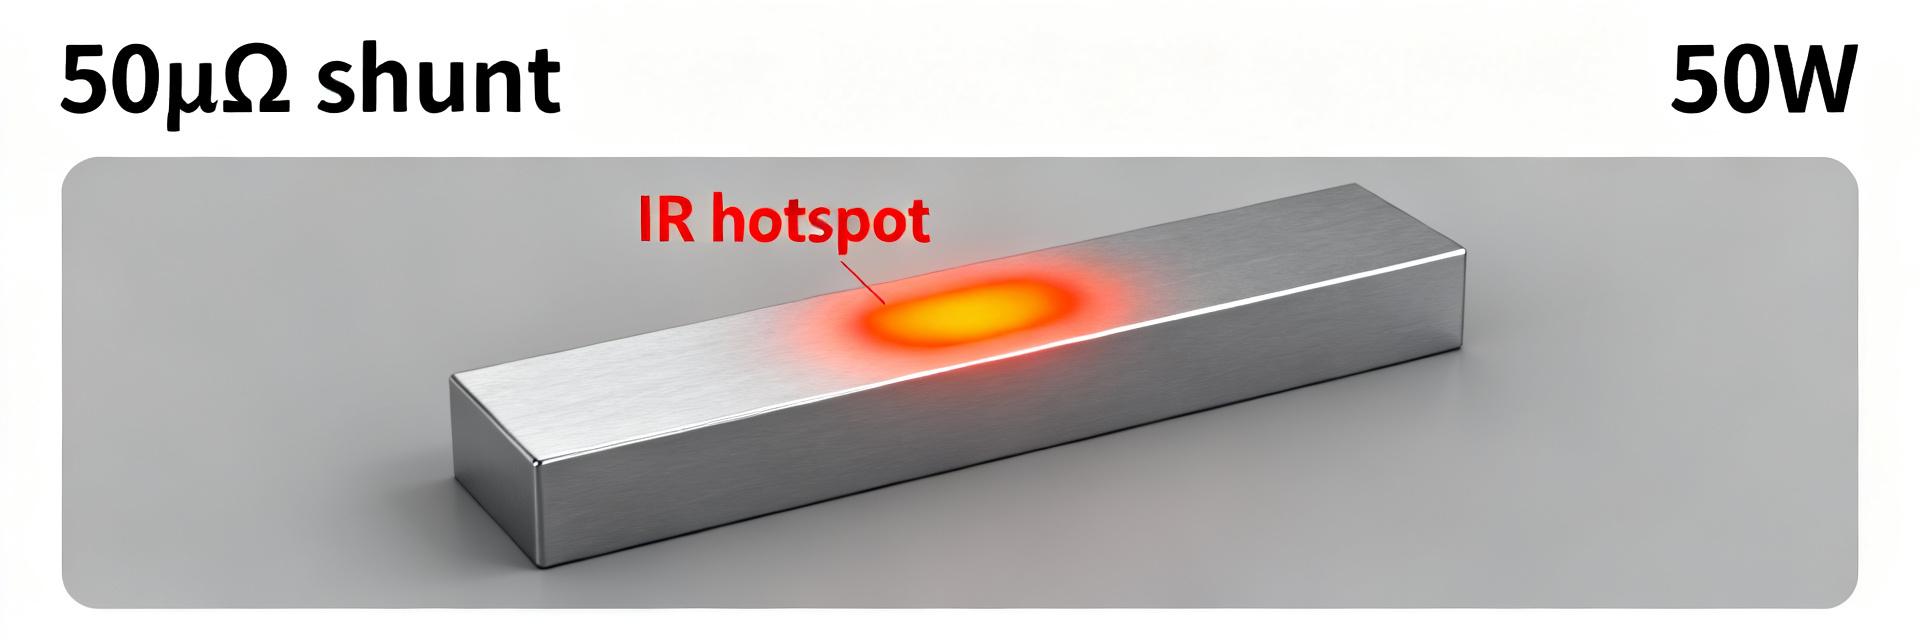
Under a step to 10 A, resistance typically rises as the element heats; measured short-term ΔR/R stabilizes over 2–6 minutes depending on fixture thermal mass. Typical observed short-term change is +15–40 ppm (0.0015–0.0040%) after warm-up. Control fixtures and consistent ambient conditions are essential to separate self-heating from intrinsic drift when reporting stability numbers.
TCR characterization: methods and results
How we measure TCR on a 100 μΩ device
TCR measurement uses a temperature chamber sweep (example steps: −40 → +85°C) with 4-wire resistance reads at each setpoint after thermal equilibrium. Measurement cadence: wait 10–20 minutes per step or until ΔR stabilizes within measurement noise. Compensate for self-heating by using low test currents for TCR runs and apply extrapolation to correct for any residual Joule heating; report ppm/°C using linear fit over the operating range.
Reported TCR results and their impact on accuracy
Sample bench TCR: +45 ppm/°C (linear fit). Across −40→+85°C this TCR produces ~+5,850 ppm total change (~0.585%), equating to a ~0.6% shift if uncompensated — larger than a 0.5% tolerance. When system accuracy needs are tighter than this drift, spec a lower-TCR part, perform hardware temperature compensation using a matched sensor, or apply firmware temperature-calibration tables.
Noise & linearity: measured noise floor, spectral data and nonlinearity
Voltage noise density and integrated noise measurements
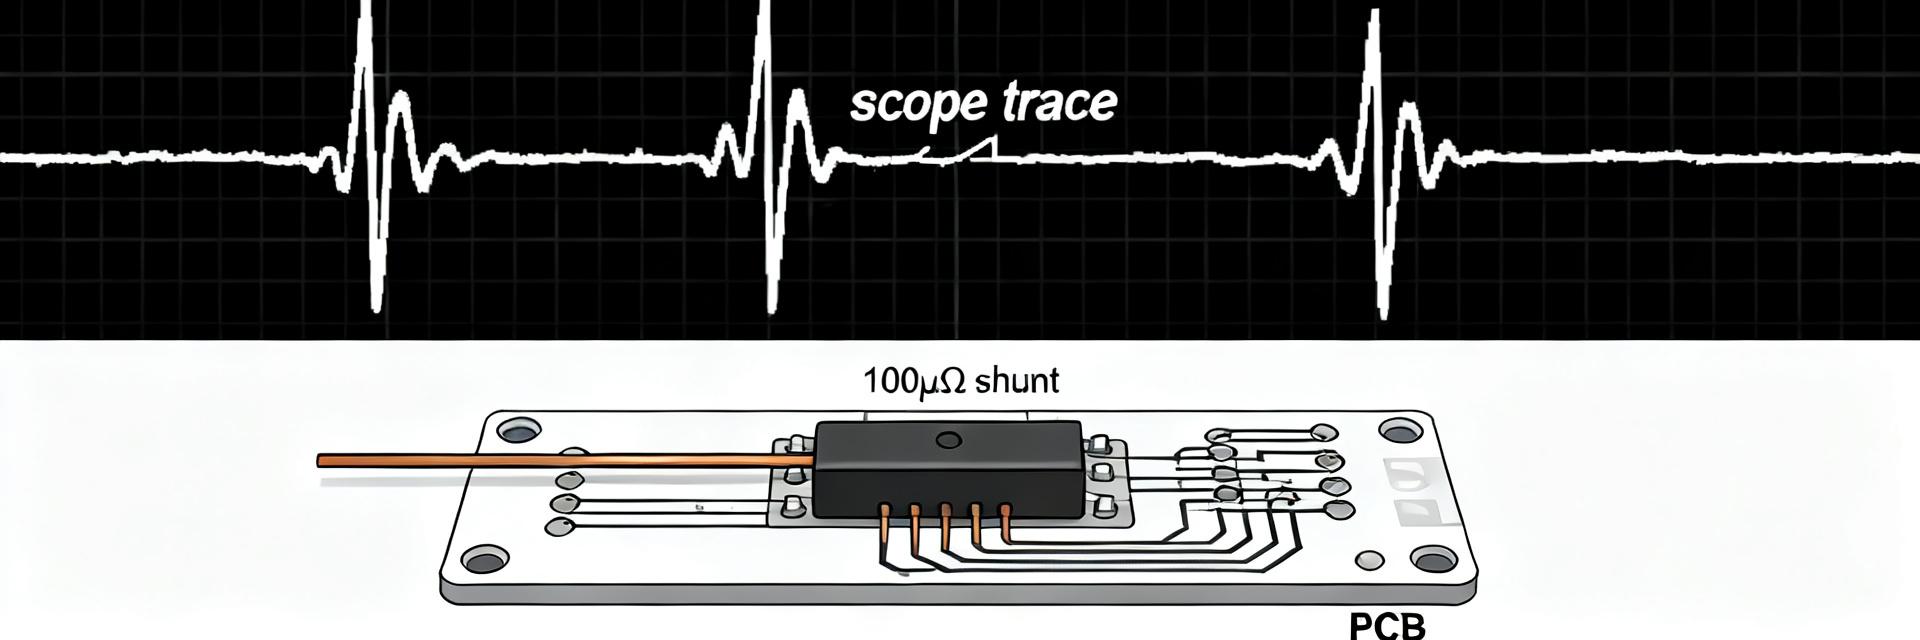
Measurement chain: low-noise amplifier with known gain, anti-aliasing filter, and FFT-based spectral analysis. Example noise density: ~0.3 nV/√Hz referenced to shunt at 10 A; integrated RMS noise 0–10 kHz ≈5 μV → equivalent current noise ≈5 μA RMS. Integrated noise scales with bandwidth and amplifier gain; list noise contributions in the uncertainty budget and choose bandwidth to meet resolution needs.
Linearity and low-current behavior
Linearity tests from 0.1 A to rated current show ppm-level deviation; typical nonlinearity under 100 ppm across 0.1–10 A for precision metal-strip shunts but with measurable offsets and hysteresis near zero due to contact and thermoelectric effects. Quantify nonlinearity as ppm of reading and include hysteresis checks (up and down ramps) in characterization SOPs.
How to measure a 100 μΩ shunt correctly: practical test fixtures & procedures
Fixture, kelvin wiring and thermal control best practices
Use four-terminal Kelvin connections with low-thermal-emf clips or soldered Kelvin tabs to eliminate lead resistance. Mount the shunt on a controlled thermal sink to increase time constant for steady readings; avoid thin fixtures that create measurement noise through temperature fluctuation. Diagram suggestions: soldered busbar for production verification and Kelvin clip for quick lab checks.
Instrumentation, filtering and data-processing tips
Recommended instruments: low-noise nanovoltmeter or lock-in for tiny signals, low-noise preamp if needed, and temperature chamber for TCR. Use anti-aliasing filters, average multiple sweeps, and subtract system noise by measuring shorted-input baseline. SOP checklist: warm-up time, calibration against traceable standard, multiple repeats, and documented uncertainty budget.
Practical integration: PCB, amplifier interface, and verification checklist
Example: integrating a 100 μΩ, 0.5% shunt in a 10 A system
At 10 A the expected drop is ~1.0 mV and power ~10 mW; choose amplifier gain so that full-scale ADC input spans this range (e.g., gain 200 → 200 mV FS). For a 12-bit ADC with 3.3 V Vref, LSB current resolution = I_fullscale / 4096; compute mapping and ensure common-mode and input protection (transient clamps) are present. Verify amplifier offset and drift do not dominate the error budget.
Design and production verification checklist
Pass/fail tests: baseline resistance at 25°C, TCR sweep, integrated noise at representative currents, thermal cycling, and lot sampling per production volume. Document for each test: conditions, measurement uncertainty, fixture ID, and calibration traceability. Maintain a sampling plan to detect manufacturing shifts early.
Key summary
- 100 μΩ shunt resistor offers millivolt-level sensing at high currents; expect ~1.0 mV at 10 A and plan amplifier/ADC gain accordingly.
- Measured bench TCR near +45 ppm/°C can produce ~0.6% change across wide temperature ranges; compensate in hardware or firmware when tighter accuracy is required.
- Noise and short-term thermal settling define usable resolution; integrate spectral and time-domain measurements into the verification SOP before production.
FAQ
How does TCR affect accuracy for a 100 μΩ shunt resistor?
TCR causes resistance changes with temperature and can dominate the error budget when resistor tolerance is similar to temperature-induced drift. A TCR of +45 ppm/°C yields roughly 0.6% shift across −40→+85°C. Designers should either specify lower TCR parts, use matched temperature sensors for compensation, or include calibration curves in firmware to maintain accuracy.
What is the best way to measure noise of a 100 μΩ shunt?
Use a low-noise amplifier with known gain, apply anti-aliasing filtering, and capture spectral data with an FFT analyzer. Measure baseline system noise with a shorted input, then measure shunt signal at representative currents and integrate the noise density over the bandwidth of interest to obtain RMS current uncertainty.
When should one choose a 0.5% shunt resistor versus a tighter tolerance?
Choose 0.5% when the overall system error budget (amplifier, ADC, TCR) allows it; if absolute accuracy must be better than ~0.5% across temperature, select tighter tolerance or implement temperature compensation. Consider cost, availability, and power rating tradeoffs when specifying tolerance for production.
Why is a 4-wire Kelvin connection mandatory for measuring a 100 μΩ shunt?
At 100 μΩ, standard lead and trace resistance can easily be several orders of magnitude higher than the shunt element. A 4-wire Kelvin connection separates the high-current force path from the high-impedance voltage sense path, preventing lead-resistance voltage drops from corrupting the measurement signal.
Conclusion
Bench DC results for a representative 100 μΩ shunt resistor show millivolt-level signals at common currents, short-term thermal settling on the order of tens of ppm, sample TCR around +45 ppm/°C, and integrated noise that can map to single‑digit microamp uncertainty. Designers should follow the outlined verification steps and measurement practices when specifying and integrating a 100 μΩ shunt resistor to ensure reliable, traceable current sensing.