100µΩ shunt resistor: Full specs & measured data report
Precision low-ohm current sensing increasingly determines system accuracy; bench testing and design reviews show that a well-characterized 100µΩ shunt resistor can be the difference between ±0.1% and ±1% system current accuracy. This report sets expectations for lab-versus-datasheet evaluation, details which shunt resistor specs matter, and previews the measured data and uncertainty that follow.
The focus is on practical measured-data presentation and uncertainty quantification rather than marketing claims. Readers can expect numeric comparisons in µΩ, mV, A and °C, sample measurement templates, and guidance on reconciling datasheet fields with bench results to validate real-world performance.
1 — Background & key specifications to expect
1.1 What a 100µΩ shunt resistor is and key use cases
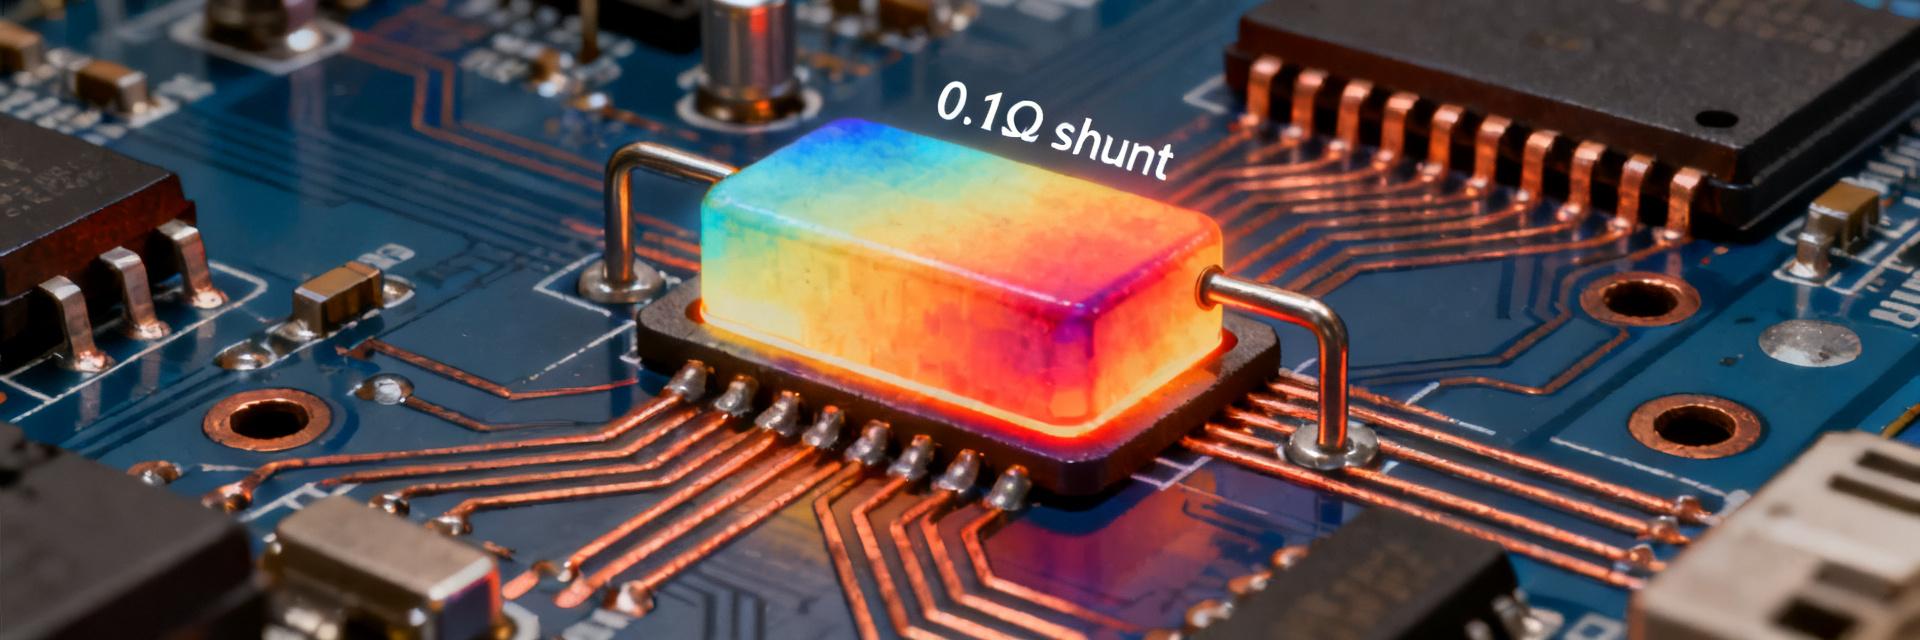
Point: A 100µΩ shunt resistor is a low‑ohmic current sensing element used where millivolt‑level drops are measured for high currents. Evidence: In power supplies, BMS, motor drives and test benches designers typically see 5 mV at 50 A and 10 mV at 100 A. Explanation: This value balances measurable voltage for ADCs and minimized I²R losses, making 100µΩ common in high‑precision sensing.
1.2 Typical shunt resistor specs on a datasheet
Point: Key datasheet fields guide selection and test planning. Evidence: Mandatory fields include nominal resistance, tolerance, TCR (ppm/°C), power rating/continuous current, thermal rise, long‑term drift, mounting/dimensions and calibration class. Explanation: Compare these shunt resistor specs to measured values; datasheet tolerances and TCR set expectations for resistance vs. temperature behavior under load.
2 — Electrical performance & thermal behavior
2.1 Resistance accuracy, tolerance, and stability under load
Point: DC accuracy under load is the primary system error source. Evidence: Nominal ± tolerance gives static accuracy, while load‑dependent deviation arises at 10%, 50% and 100% of rated current due to self‑heating and contact effects. Explanation: Report numeric deltas (µΩ) and percent error in tables at specified current points to show compliance with system accuracy targets.
2.2 TCR, thermal rise, power rating and derating curves
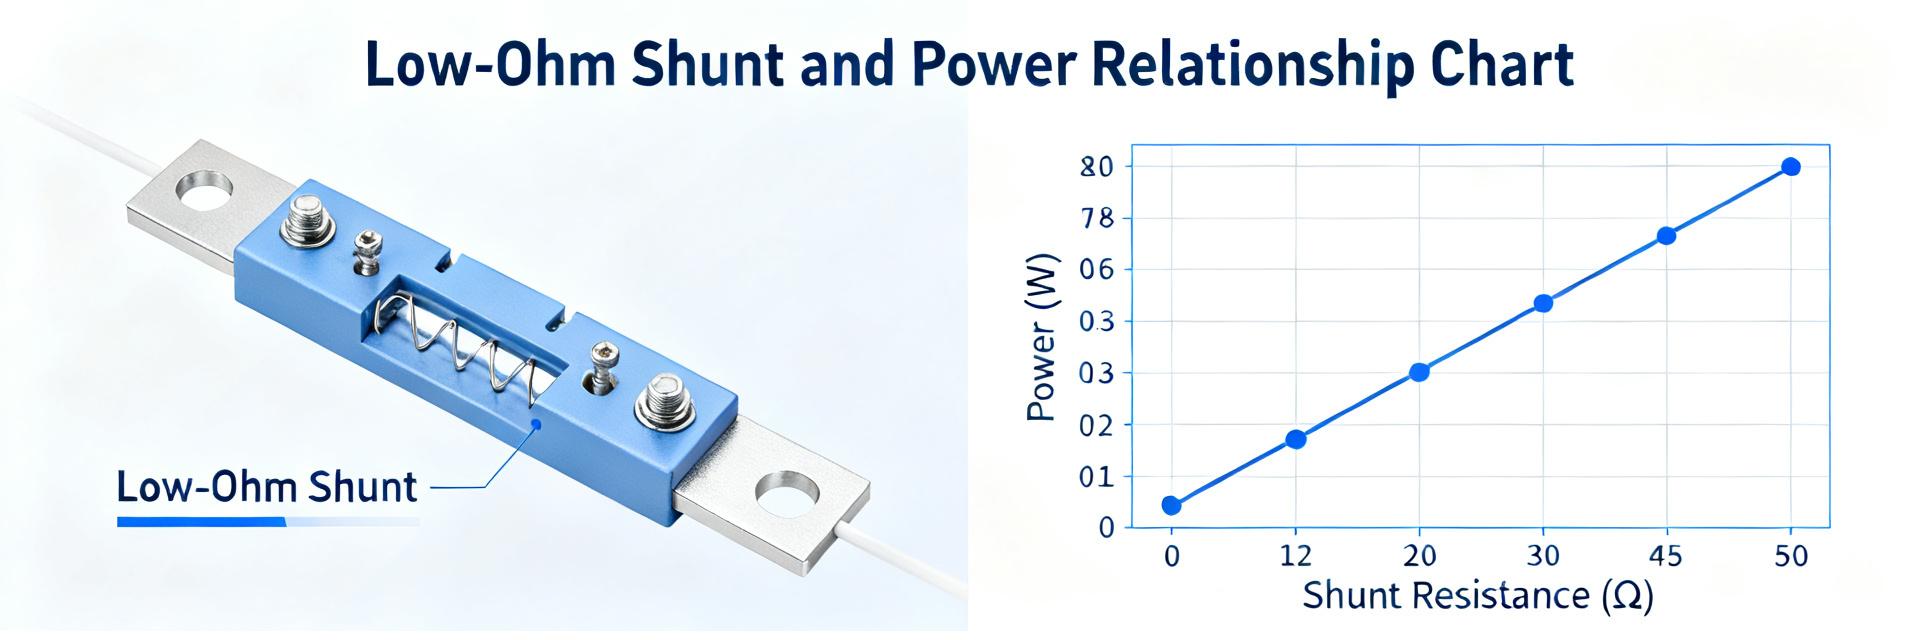
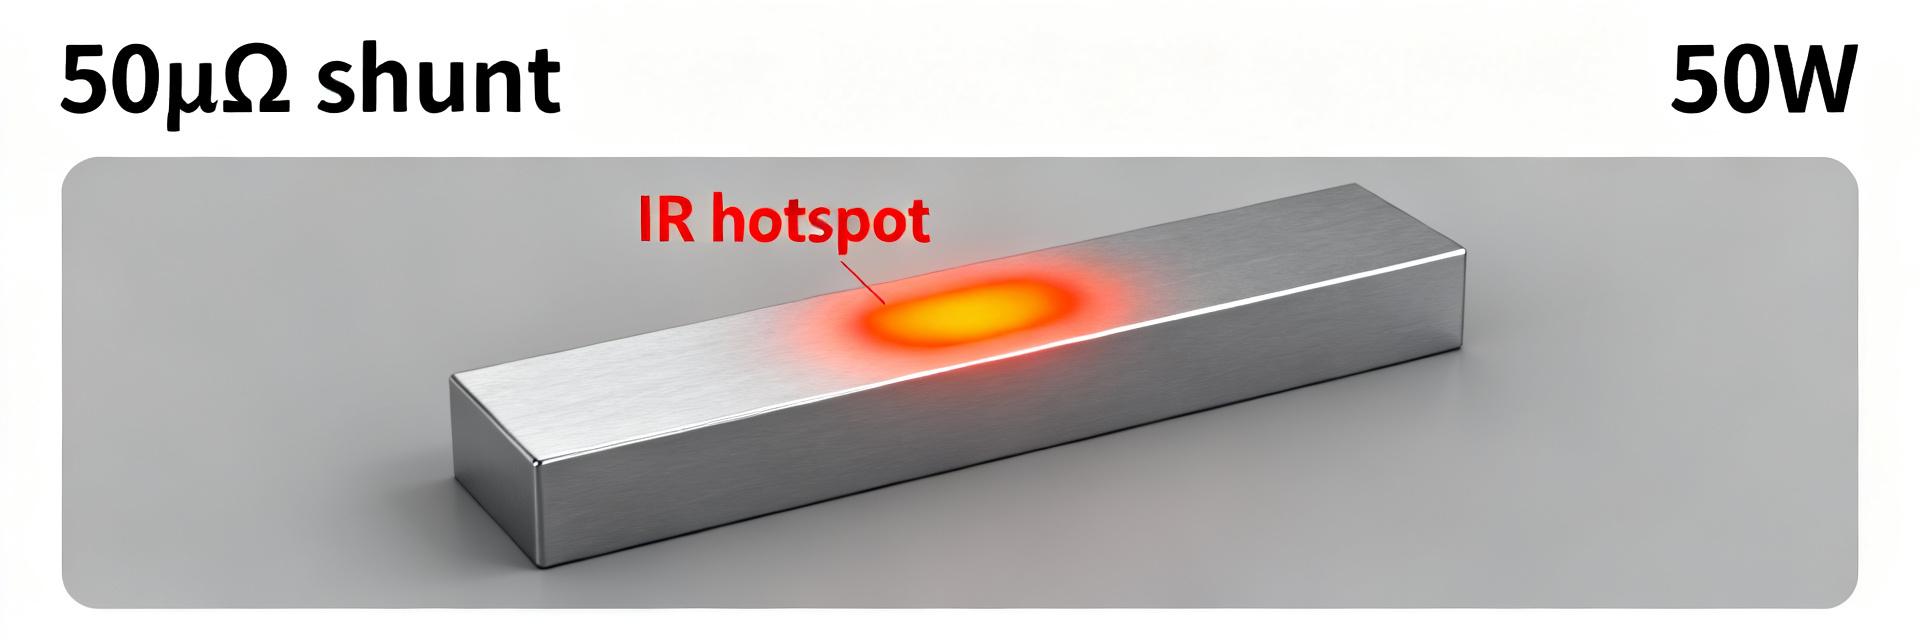
Point: Thermal behavior determines usable current and compensation needs. Evidence: TCR (ppm/°C) maps resistance vs. temperature; P = I²·R yields dissipation and expected thermal rise. Explanation: Present resistance vs. temperature plots and thermal rise vs. current to derive derating curves and specify thermal time constants for steady‑state decisions.
3 — Measurement methodology & test setup
3.1 Recommended test circuits, instruments & wiring best practices
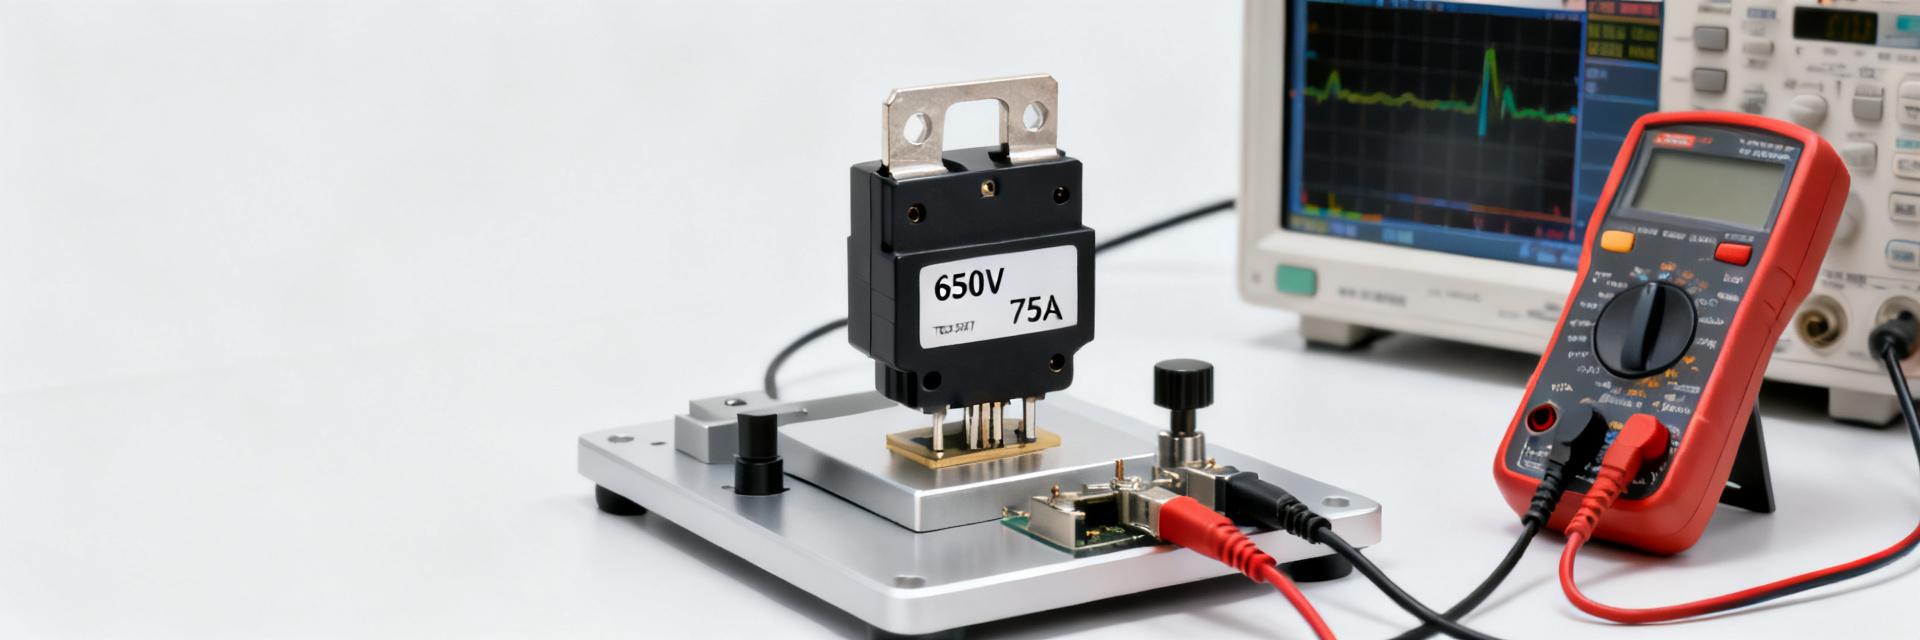
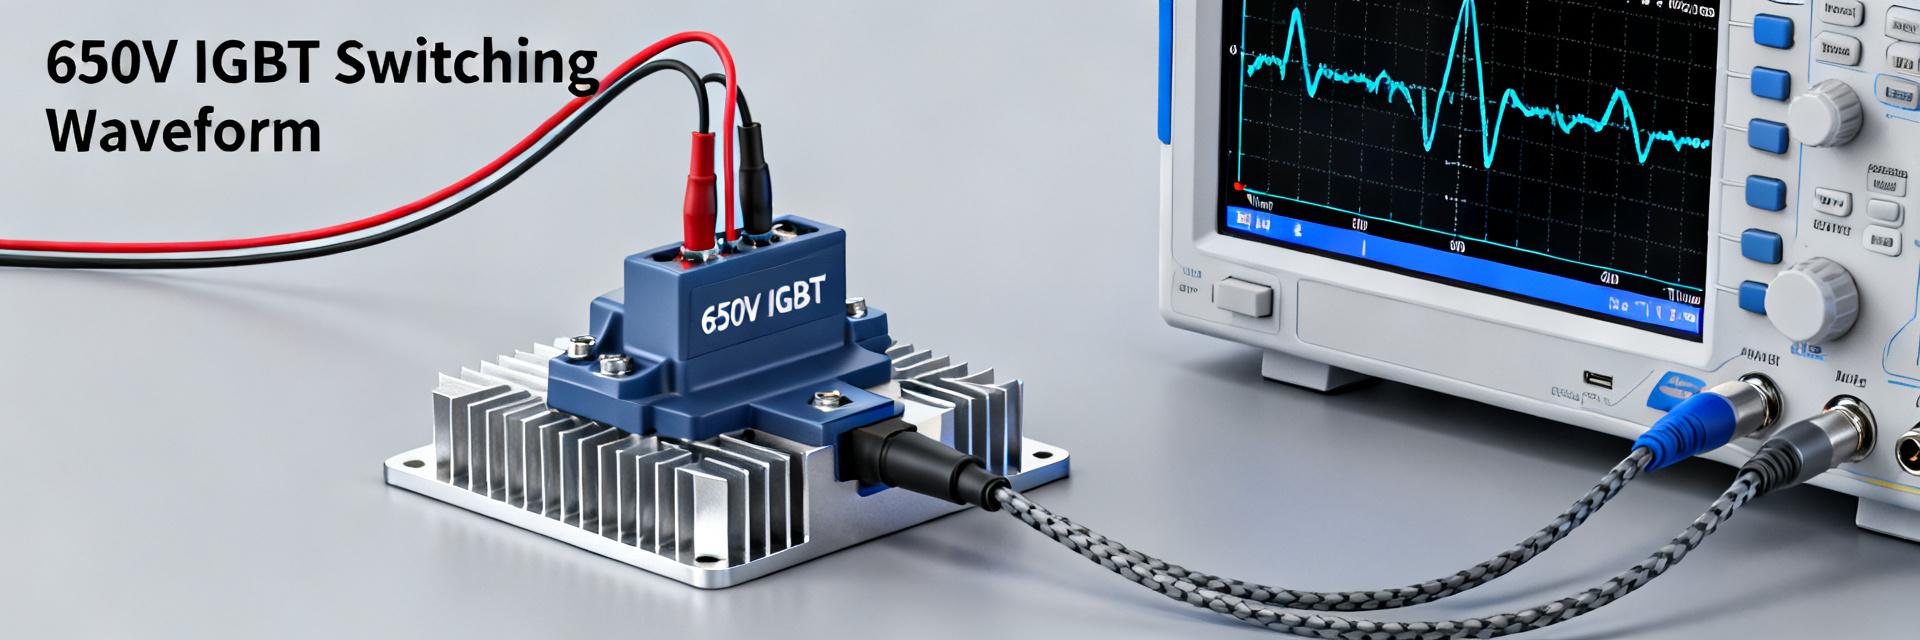
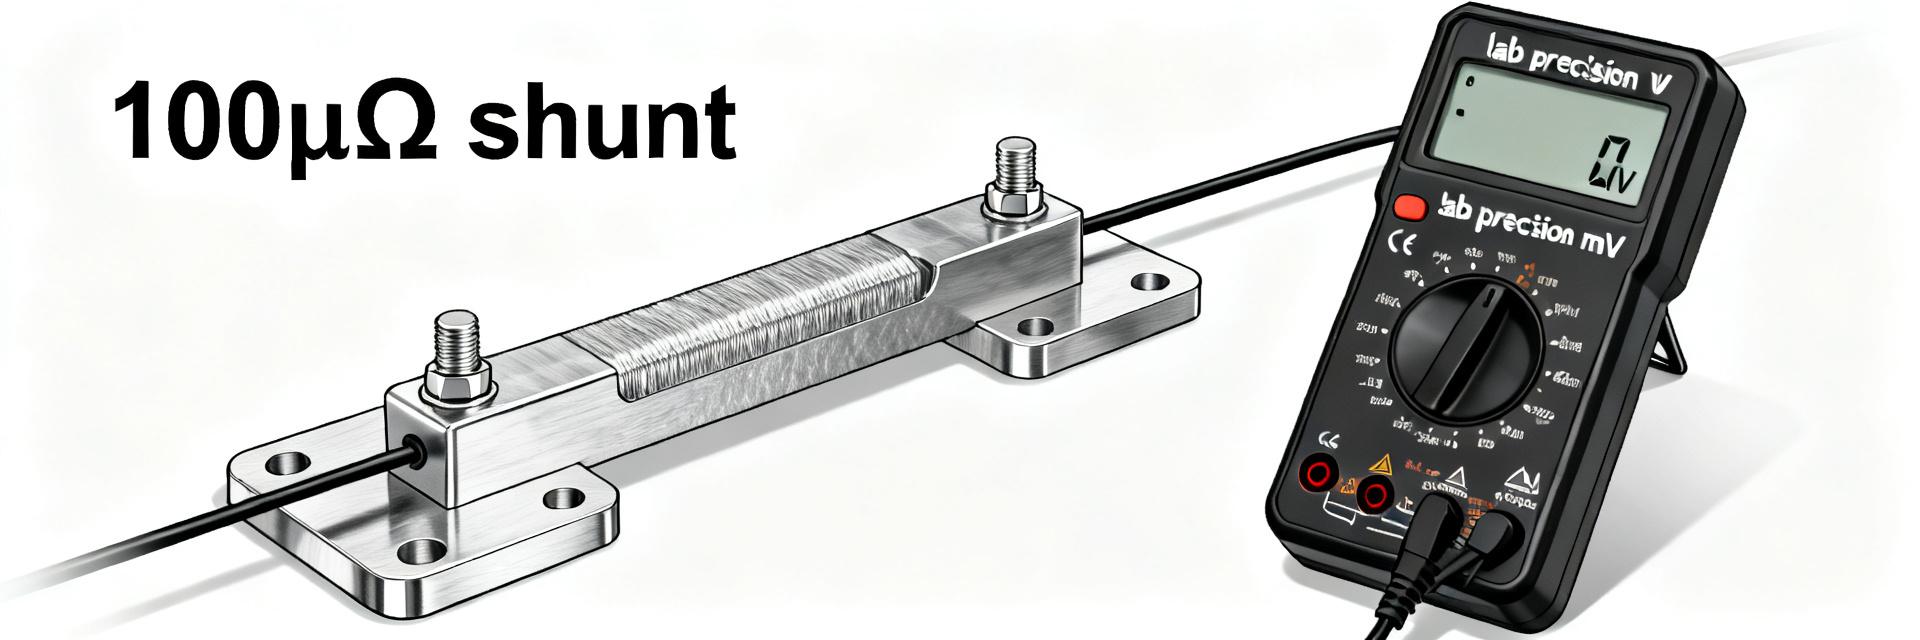
Point: Measurement fidelity requires careful wiring and instruments. Evidence: Use a 4‑wire Kelvin connection, a low‑noise current source, a high‑resolution differential voltmeter or ADC, and local temperature sensing or an environmental chamber. Explanation: Test points such as 1 A, 10 A, 50 A, 100 A with dwell times to steady state and adequate sampling rates reduce noise and isolate true resistance behavior.
3.2 Calibration, uncertainty analysis and repeatability checks
Point: Traceable calibration and uncertainty budgets build trust in results. Evidence: Calibrate against reference resistors or calibrators, quantify type A (statistical) and type B (systematic) uncertainties, and run n‑repeatability tests to compute standard deviation. Explanation: Report combined uncertainty (e.g., 95% confidence) and include a simple uncertainty budget table for readers to replicate.
4 — Lab results: measured data report & templates
4.1 Example bench results to include
Point: Mandatory datasets demonstrate real behavior. Evidence: Include R vs. current, R vs. temperature, thermal rise vs. time, Vdrop vs. current and long‑term stability datasets; example: at 50 A a 100µΩ shunt yields 5.0 mV, at 100 A yields 10.0 mV. Explanation: Present tables with units (µΩ, mV, A, °C), annotate plots with uncertainty bars and SNR implications for ADC selection.
| Current (A) | Vdrop (mV) | Inferred R (µΩ) |
|---|---|---|
| 10 | 1.00 | 100.0 |
| 50 | 5.00 | 100.0 |
| 100 | 10.0 | 100.0 |
4.2 How to present and interpret measured data
Point: Interpretation links test results to design decisions. Evidence: Compare measured values to datasheet tolerances, verify TCR trends, and inspect derating behavior and hysteresis after cycles. Explanation: Red flags include nonlinearity vs. current, excessive thermal drift, and large post‑cycle hysteresis; provide a pass/fail checklist and sample summary table for quick assessment.
Expert note: Reliable current sensing depends on both tight shunt resistor specs and rigorous measured data reporting; uncertainty and repeatability are as important as nominal numbers.
5 — Selection checklist & practical design recommendations
5.1 Choosing the right 100µΩ shunt resistor for your application
Point: Selection balances accuracy, power and form factor. Evidence: Consider required accuracy, continuous versus pulsed current, thermal environment, mounting style and available calibration. Explanation: Use measured data together with shunt resistor specs to set thresholds (e.g., TCR <50 ppm/°C, tolerance ≤0.5%, stability <100 ppm over 1000 h) when targeting high‑accuracy systems.
5.2 PCB layout, thermal management and calibration tips for reliable readings
Point: Layout and thermal strategy directly affect measurement quality. Evidence: Implement Kelvin sense routing, isolate current path, add thermal vias and copper area, and place a temperature sensor near the shunt. Explanation: Calibrate for offset, apply temperature compensation using measured TCR, and choose sampling/averaging strategies to improve SNR for low‑mV signals.
Summary
- Combine datasheet shunt resistor specs with bench measured data to validate true resistance, TCR and thermal derating; report units in µΩ, mV, A and °C for clarity and traceability.
- Adopt a 4‑wire Kelvin measurement, traceable calibration and an uncertainty budget (95% confidence) to quantify measurement error and repeatability in your measured data reports.
- Design for thermal control: compute P = I²·R, build derating curves, and use local temperature sensing to compensate resistance changes in firmware for stable readings.
- Select a 100µΩ shunt resistor when the trade‑off between measurable voltage and acceptable I²R loss meets system accuracy and thermal constraints; verify via the recommended test suite.
FAQ
How does TCR affect 100µΩ shunt resistor accuracy?
TCR (ppm/°C) quantifies resistance change with temperature; for a 100µΩ shunt, a 100 ppm/°C TCR implies a 0.01µΩ change per °C, which translates to a few µV change at high currents. Measure TCR across the expected temperature range and apply temperature compensation in firmware to maintain system accuracy.
What measurement uncertainty should I report for shunt resistor measured data?
Report combined uncertainty with a 95% confidence level, listing type A (statistical) and type B (systematic) contributions such as instrument accuracy, lead resistance, and thermal gradients. A realistic target for high‑accuracy setups is combined uncertainty below 0.1% of reading, documented in an uncertainty budget table.
Which ADC resolution is needed for a 100µΩ shunt resistor at 100 A?
At 100 A the Vdrop ≈10 mV; to resolve 0.01% changes you'd need sub‑µV resolution after front‑end amplification. Choose a high‑resolution differential ADC or precision ADC with a low‑noise amplifier, ensure adequate SNR, and account for offset and drift in calibration to meet stringent accuracy goals.
How does PCB layout affect the performance of a 100µΩ shunt?
Layout has a massive impact. 4-wire Kelvin routing must connect directly to the inner edges of the shunt's solder pads to exclude power trace solder resistance. Additionally, thermal symmetry and dedicated thermal vias prevent temperature-induced EMF offsets and TCR-driven resistance deviations under load.