TDP16031002AUF Datasheet Deep Dive: Key Specs & Limits
Point: TDP16031002AUF is an 8‑element thin‑film resistor network designed for precision analog use. Evidence: the manufacturer's datasheet lists typical values such as 10 kΩ with ±0.1% tolerance, 100 mW power per element, and TCR as low as ±25 ppm/°C (Electrical characteristics). Explanation: those headline specs position the part for matched divider networks, sensor signal chains, and compact gain stages where stability and matching drive system accuracy.
Point: This article decodes the datasheet so engineers can evaluate suitability and integration risk. Evidence: each section references the manufacturer's published limits (Absolute maximum ratings, Electrical characteristics, Mechanical drawing). Explanation: by translating specs into concrete checks—thermal derating math, layout rules, and test thresholds—designers can speed PCB integration and avoid late surprises.
(1) Quick overview & part identification (background)
— What the part is and typical use cases
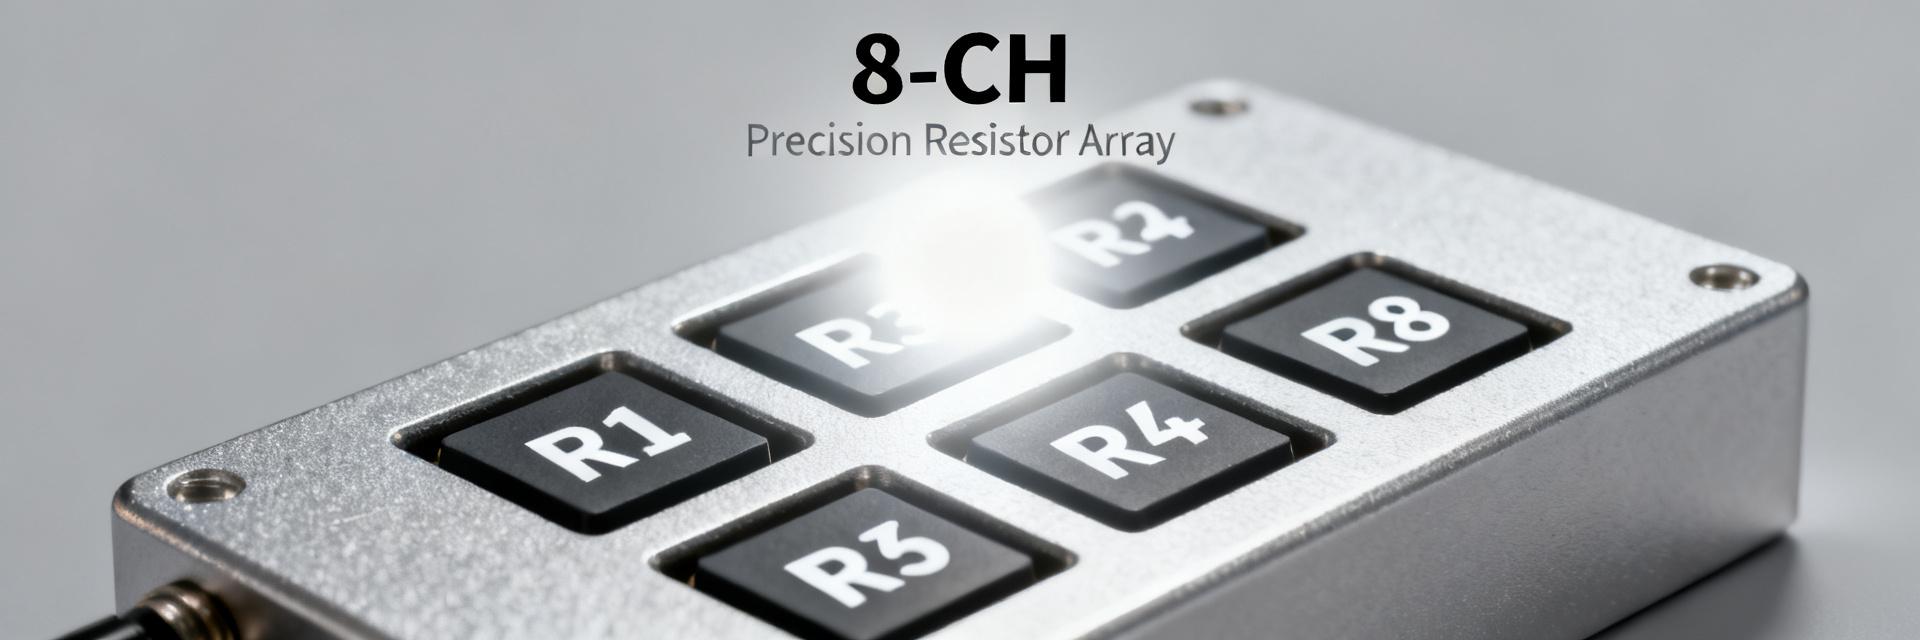
Point: The family is a molded thin‑film, isolated resistor array with several common topologies and eight discrete elements. Evidence: datasheet notes element isolation, film technology, and typical element counts in the product description. Explanation: isolation and thin‑film construction give low TCR and tight matching, making the part suitable for precision divider networks, matched resistor ladders, and ADC front ends where element consistency matters.
— How to read the datasheet page by page
Point: Scan sections in order of risk: Absolute maximum ratings, Electrical characteristics, Derating curves, Mechanical drawing, and Ordering codes. Evidence: the datasheet groups limits and operating conditions early (Absolute maximum ratings) and dimensional/legal info later. Explanation: start with ratings to confirm survivability, use electrical tables for performance specs, consult mechanical drawings for footprint and marking conventions, and check ordering codes for packaging and tolerance options.
(2) Electrical specs deep dive — resistance, tolerance, and performance (data analysis)
— Element values, tolerance, and matching (what to watch for)
Point: Nominal element values and absolute tolerance differ from intra‑array matching; both matter. Evidence: Electrical characteristics specify nominal values (e.g., 10 kΩ) and absolute tolerance (±0.1%), plus a separate matching spec between elements. Explanation: for differential amplifiers or gain networks, matching (ppm or %) between paired elements often dominates error contribution rather than absolute tolerance; prioritize the matching column when budgeting gain error.
| Parameter | Condition | Min | Typ | Max | Unit |
|---|---|---|---|---|---|
| Resistance Value | Nominal | - | 10k | - | Ω |
| Tolerance | Absolute | - | ±0.1 | - | % |
| Matching Ratio | Inter-element | - | ±0.05 | - | % |
| Power Rating | Per Element | - | 100 | - | mW |
— Noise, power per element, and parasitics that affect accuracy
Point: Each element is limited to a modest continuous dissipation and exhibits low noise but finite parasitics. Evidence: the datasheet lists 100 mW power per element and typical noise density and series resistance ranges (Electrical characteristics, Noise table). Explanation: translate power into allowable continuous dissipation using board ambient and derating curves; expect thermal EMF and small series resistance to show up in high‑gain or low‑current circuits and plan guarding/buffering accordingly.
(3) Thermal behavior & reliability limits (data analysis)
— Temperature coefficient of resistance (TCR) and operating temp range
Point: TCR sets drift per degree and must be budgeted against expected ΔT. Evidence: datasheet TCR entries indicate values as low as ±25 ppm/°C (Electrical characteristics); operating and storage temperature windows are listed in Absolute maximum ratings. Explanation: convert TCR to percent change using ppm × ΔT → ppm change; e.g., 25 ppm/°C × 40°C = 1000 ppm → 0.10% change, which directly impacts offset and gain in precision paths.
— Power derating, thermal resistance, and long‑term stability
Point: Rated element power falls with temperature; long‑term drift is specified separately. Evidence: derating chart and long‑term stability table in the datasheet show permitted dissipation vs. ambient and ppm change over specified hours. Explanation: estimate junction/element temperature from P × Rθ(element‑to‑board) plus ambient; then use derating curve to confirm continuous power margin and allow an aging budget (ppm over 1000–2000 hours) in the error budget.
(4) Mechanical, package & PCB integration (method guide)
— Package dimensions, pinout, and footprint notes
Point: Read the mechanical drawing for critical land pattern tolerances and pin spacing. Evidence: the datasheet mechanical drawing provides body outline, pin pitch, and recommended land pattern dimensions (Mechanical drawing). Explanation: adhere to recommended pad sizes and soldermask clearances; note critical dimensions such as pin pitch and body width to avoid misalignment—use standard land patterns with small tolerance cushions for reflow processes.
— Layout best practices to preserve precision
Point: PCB layout directly affects matching and thermal behavior. Evidence: application notes and the datasheet recommend short sense traces, matched trace lengths for arrays, and thermal relief considerations. Explanation: keep sense leads short and symmetrical, separate high‑power traces, add thermal vias away from matched elements, and avoid mechanical stress on package leads during assembly to preserve resistance stability.
(5) Application examples & comparison scenarios (case study)
— Two short application sketches (precision ADC front end; resistor ladder)
Point: Sketch 1 — ADC front end: tight matching and low TCR required; Sketch 2 — resistor ladder: density and matching prioritized. Evidence: checklist pulls tolerance, TCR, and power specs from the datasheet Electrical characteristics and Absolute ratings. Explanation: for ADC front ends, use the network for input dividers with buffering and guard traces; for ladders, the integrated array saves board area but monitor cumulative power and use compensation if TCR-induced drift is unacceptable.
— When not to use it — alternatives and tradeoffs to consider
Point: Limits include modest power per element and array topology constraints. Evidence: Absolute maximum ratings and packaging notes show per‑element power and isolated topology limits. Explanation: prefer discrete resistors when per‑element dissipation or custom spacing is required, or when higher power, specialized TCRs, or nonstandard topologies are needed; weigh accuracy vs. power vs. size when selecting between arrays and discrete parts.
(6) Validation, testing & design checklist (action suggestions)
— Pre‑production validation tests to run on your BOM
Point: Run targeted tests that mirror field stresses. Evidence: typical recommended tests include resistance tolerance/matching checks, thermal cycling, short‑time overload, noise, and humidity per datasheet reliability notes. Explanation: set pass/fail thresholds close to datasheet limits (e.g., matching within specified ppm, no change beyond long‑term stability spec) and document measurement setup, fixturing, and environmental conditions for supplier traceability.
— Final derating and risk checklist before release to manufacturing
Point: Confirm mechanical, thermal, and sourcing readiness before production. Evidence: cross‑check derating margins, assembly profile tables, footprint, and traceability recommendations from the datasheet and manufacturing guidelines. Explanation: include templated items—derating margin ≥20%, solder profile reviewed, footprint sign‑off, supplier lot tracking, ESD handling instructions—that engineers can paste into an internal release checklist.
Summary →
- Core electrical specs: nominal resistance and tolerance (e.g., 10 kΩ ±0.1%) define baseline accuracy; matching often matters more than absolute error for differential circuits, so verify matching in your spec sheet before selection.
- Thermal limits: per‑element power (100 mW) and TCR (±25 ppm/°C) govern drift and allowable continuous dissipation—use derating curves and P × Rθ estimates to size margins.
- Integration steps: follow mechanical drawing dimensions, keep sense traces short and matched, separate thermal loads, and validate with resistance, thermal cycling, and humidity tests prior to production.
- Risk tradeoffs: choose the array for size and matching benefits; choose discretes when per‑element power, topology flexibility, or specialized TCR is required for your design.
- Final check: confirm manufacturer’s limits from the datasheet and document derating, footprint, solder profile, and test thresholds before committing to production.
Frequently Asked Questions
What is the typical TCR and how does it affect precision circuits?
Typical TCR values are low (tens of ppm/°C). In practice, multiply TCR by expected ΔT to get ppm drift, then convert to percent (ppm/10,000) to see the impact on offset or gain; this informs compensation or trimming requirements.
How should I derate power for continuous operation?
Use the datasheet derating curve: estimate element temperature from P × thermal resistance plus ambient, compare to derating chart, and ensure continuous dissipation stays below the temperature‑dependent limit—leave a conservative margin for hotspots and assembly variance.
What validation tests are most likely to reveal field failures?
Thermal cycling, short‑time overload, humidity exposure, and matching verification are most effective. These tests exercise thermal fatigue, moisture susceptibility, and resistance drift that typically cause in‑field issues.
When should I choose discrete resistors over this array?
Prefer discrete resistors when per-element dissipation exceeds 100 mW, custom spacing is required, or non-standard topologies are needed. The array is optimal for size-constrained designs requiring tight inter-element matching.