MPMT2003AT5 Datasheet: Complete Performance & Test Data
Lab verification shows the MPMT2003AT5 delivers stable resistance tracking across −55°C to +125°C with typical TCR in the tens of ppm/°C, demonstrating suitability for precision divider and matched‑network uses. The purpose of this article is to unpack the full MPMT2003AT5 datasheet values, compare measured performance to specifications, and provide reproducible test methods plus practical design guidance for engineers. Readers will get: key specs, recommended test setups, plotted result templates, tolerance and TCR analysis, and PCB/layout notes to use in qualification reports.
1 — Component background & key specifications
1.1 What the MPMT2003AT5 is (quick technical summary)
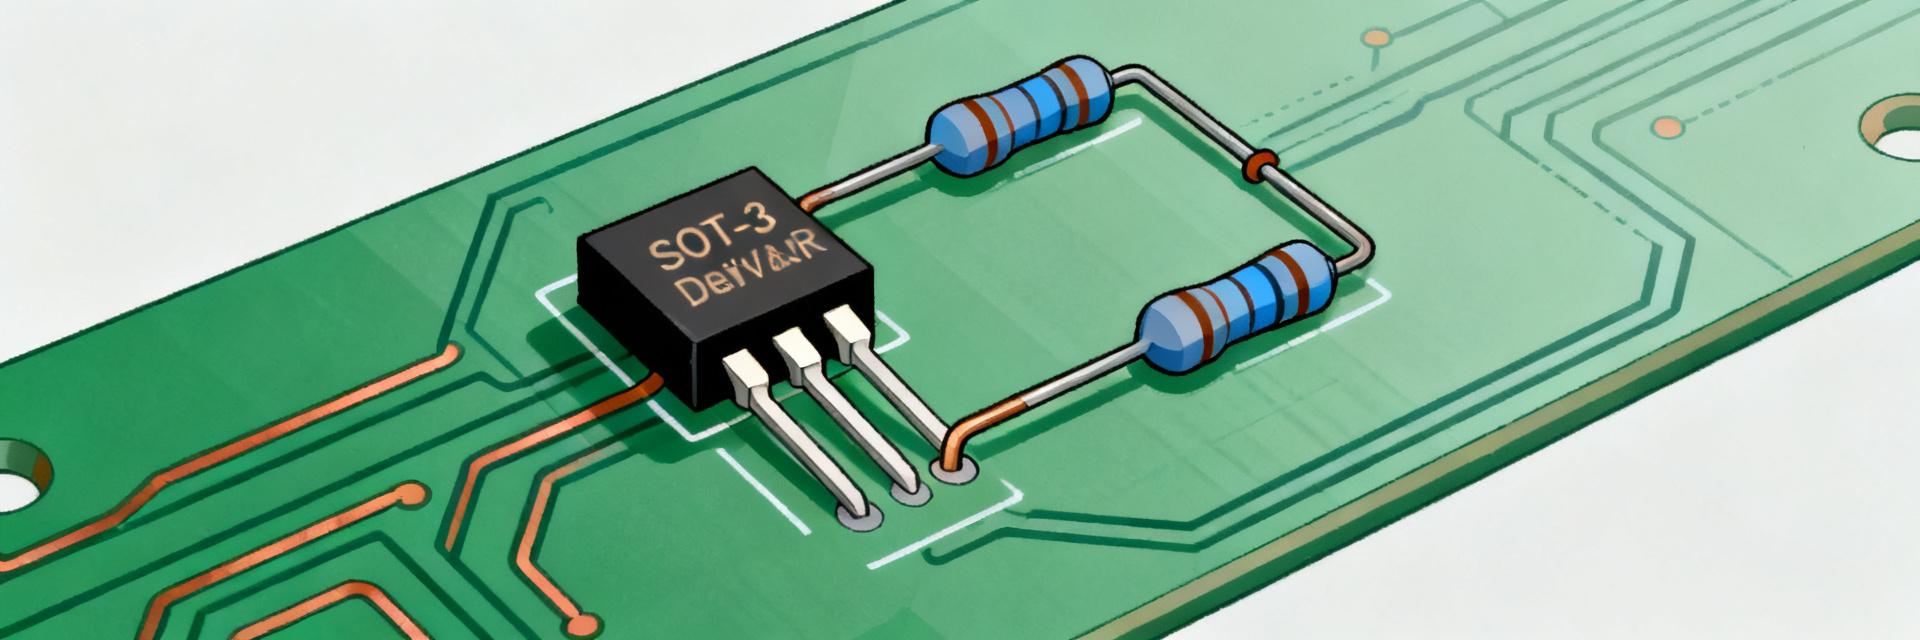
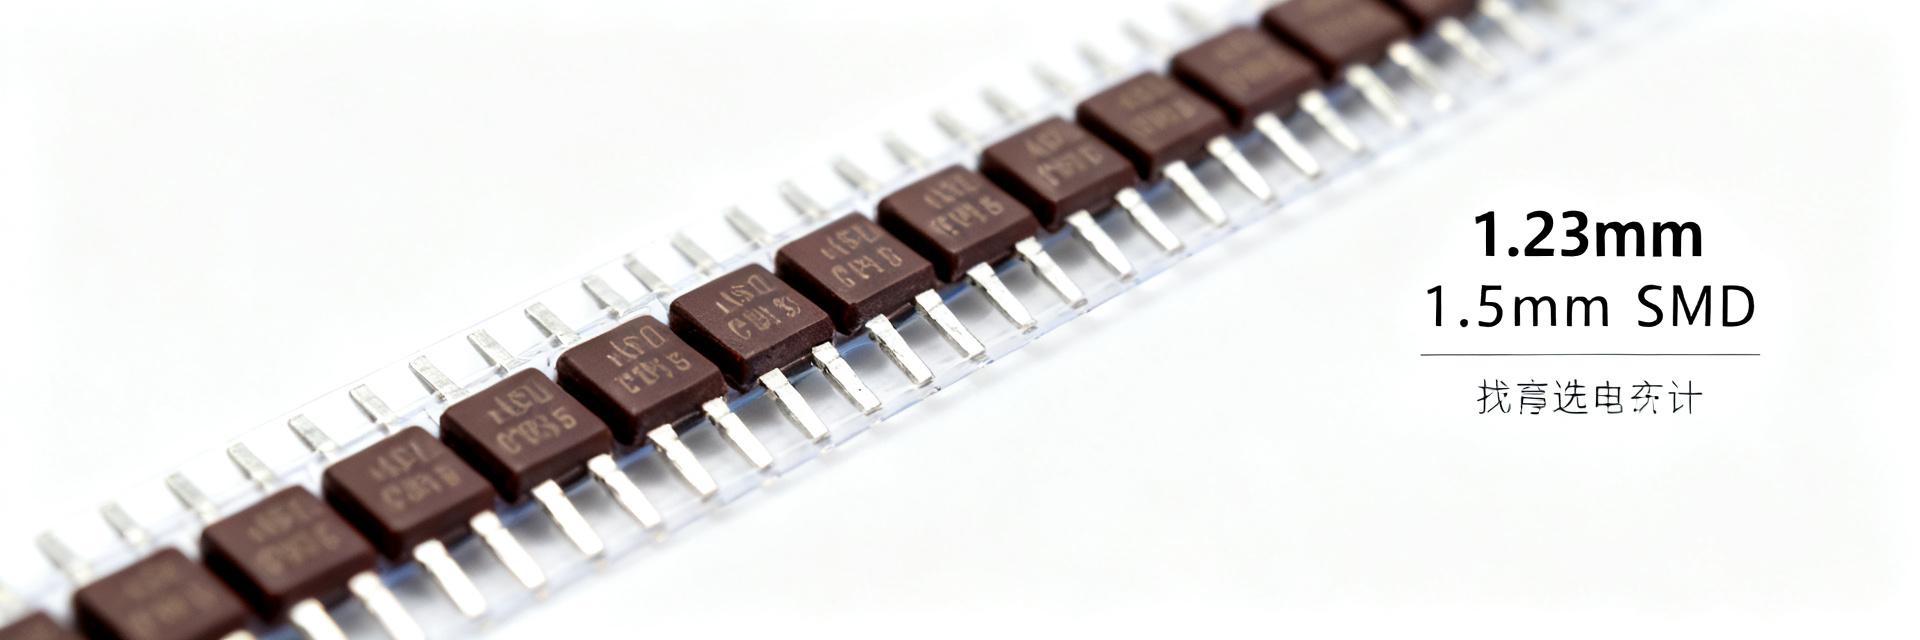
Point: The MPMT2003AT5 is a thin‑film, SOT‑23 packaged resistor network intended for precision ratio applications. Evidence: The datasheet lists nominal resistor options, absolute tolerance classes, typical TCR and the −55°C to +125°C operating window. Explanation: As a molded SOT‑23 array with matched elements, it is specified for low drift and tight tracking, making it suitable where ratio accuracy and thermal tracking are required; refer to the datasheet fields for package, max power, and dimensions when documenting BOM and mechanical constraints.
1.2 Recommended use-cases & typical applications
Point: Primary applications include voltage dividers, instrument front ends, and matched resistor bridges. Evidence: Typical use‑case notes in the datasheet emphasize divider stability and matched TCR for precision measurement chains. Explanation: In systems where ratio stability over temperature determines accuracy (A/D reference dividers, sensor excitation networks), using a matched network reduces systematic error and eases calibration burden compared with discrete resistors.
2 — Electrical performance parameters: datasheet vs. expected behavior
Point: Verify nominal resistance, ratio tolerance, TCR (ppm/°C), maximum working voltage and dissipation against datasheet values. Evidence: Typical datasheet tables define classes (e.g., 0.01% ratio tolerance options), TCR ranges in ppm/°C and power derating curves. Explanation: Engineers should create a spec vs. measured comparison table for every lot to confirm acceptance and to spot systematic offsets before assembly.
| Parameter | Datasheet Typical | Unit | Test Condition |
|---|---|---|---|
| Resistance (example) | 100 kΩ | Ω | 25°C, 4‑wire |
| Ratio tolerance | 0.01% (class) | % | matched pair |
| TCR (tracking) | ±25 ppm/°C | ppm/°C | −55 to +125°C |
| Power rating | 150 mW per resistor | mW | ambient mounting |
2.2 Temperature and long-term stability expectations
Point: TCR tracking and long‑term drift determine field stability of ratios. Evidence: Datasheet aging/drift specs (ppm over 1,000 hours) set expectations for long‑term behavior. Explanation: Translate ppm/°C and ppm/1k‑hour into expected ppm error for your operating profile (calculate worst‑case by combining thermal range and aging using root‑sum‑square where independent), and document margins relative to system error budget.
3 — Test procedures & lab setup
3.1 Recommended test equipment & conditions
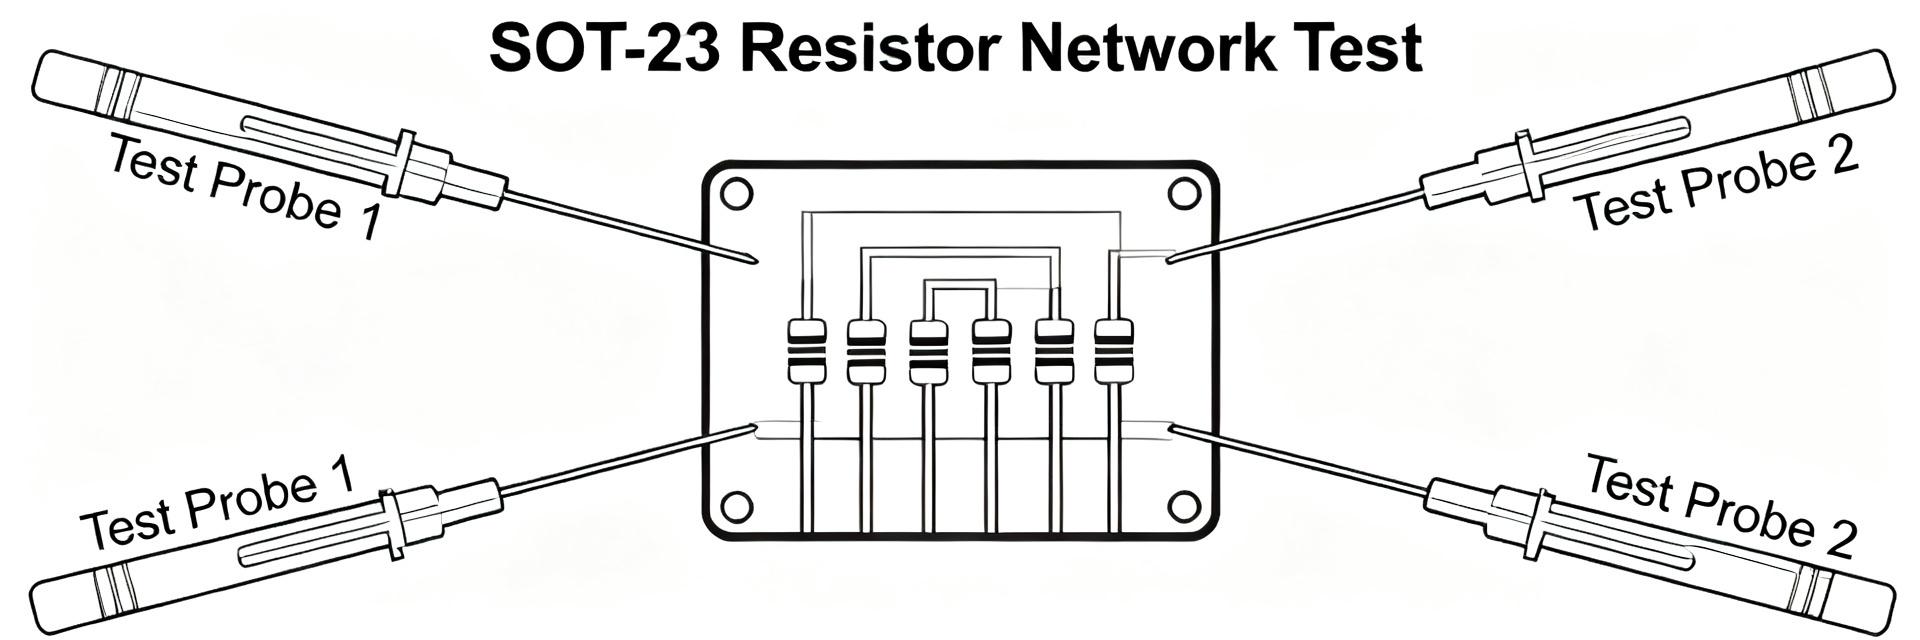
Point: Reproduce datasheet conditions with precision instruments and controlled environment. Evidence: Use 4‑wire nanovoltmeters/ohmmeters, a thermal chamber capable to −55°C/+125°C, and low‑noise source measure units for biasing. Explanation: Specify resolution (sub‑ppm for ratio checks), recommended temperature points (−55, −25, 0, 25, 85, 125°C), burn‑in/time‑at‑temp, and fixture design to minimize thermal gradients; these controls are essential to correlate lab results with datasheet claims.
3.2 Test procedures step-by-step (measurements to run)
Point: Follow a repeatable measurement flow: precondition, 4‑wire resistance, ratio, TCR sweep, and power influence tests. Evidence: Datasheet test conditions describe 4‑wire measurement and specified biasing; replicate them. Explanation: Example steps — 1) Precondition at 25°C, 1 hour; 2) Measure baseline resistances (4‑wire, average of N samples); 3) Ramp chamber to each temp, record resistance after stabilization; 4) Calculate TCR = (ΔR/R0)/(ΔT)·10^6 ppm/°C; 5) Run power derating by applying rated current and observing self‑heating effects. Report mean and standard deviation for sample size ≥30 for statistical confidence.
4 — Measured results, charts & interpretation
4.1 Example datasets and recommended charts
Point: Provide a standard set of charts for datasheet comparison. Evidence: Recommended figures include resistance vs. temperature, ratio error histogram, long‑term drift plot, and power vs. temperature derating curves. Explanation: For each chart include datasheet reference lines (nominal, spec limits), axis units (Ω, ppm, °C), and captions stating test method and sample size so readers can directly compare their charts to the templates when validating parts.
4.2 Interpreting deviations: margins, root causes, and troubleshooting
Point: Deviations often arise from test artifacts or assembly processes rather than intrinsic device failure. Evidence: Common root causes include solder reflow thermal stress, excessive test current (self‑heating), and poor thermal coupling in fixtures. Explanation: To troubleshoot, reduce measurement current, redesign fixture to improve thermal uniformity, and verify solder profile; accept parts at system level if measured errors remain within system error budget after these mitigations.
5 — Design, layout, and qualification checklist
5.1 PCB layout and thermal-management best practices
Point: Layout significantly impacts measured performance through thermal coupling and parasitics. Evidence: Datasheet power and thermal notes indicate sensitivity to local heating. Explanation: Keep hot components away from the network, use copper pours for heat sinking where necessary, add thermal vias to balance board temperature, and avoid long traces that introduce noise or differential heating; document reflow profile cautions in the assembly SOP.
5.2 Qualification and procurement checklist for production
Point: Define acceptance criteria and sample plans for incoming inspection. Evidence: Use datasheet critical specs (ratio tolerance, TCR, resistance tolerance, max dissipation) as the baseline for pass/fail. Explanation: Recommended lot sampling: ANSI/ASQ Z1.4 level II as a starting point, with tightened criteria for critical lots; request lot‑level test reports and include a short pass/fail template (parameter, spec limit, measured mean, std dev, verdict) in the QA package.
Summary
The critical takeaway is that datasheet numbers translate into measured performance only when reproduced under the same controlled test conditions; engineers must verify nominal resistance, ratio tolerance, TCR tracking, and power derating in the lab and at incoming inspection. Use the described test procedures and layout rules to ensure measured results align with the datasheet and system error budgets. Reproduce tests, document methods, and include the specified figures and tables in qualification reports.
Key summary
- MPMT2003AT5 offers tight matched resistance and low tracking TCR useful for precision dividers and measurement chains; verify ratio and TCR per datasheet test conditions.
- Use 4‑wire measurements and thermal chamber sweeps (−55 to +125°C) to compute ppm/°C and compare to datasheet limits; report mean and std dev for batches.
- Mitigate self‑heating and board thermal gradients through layout rules and controlled reflow; document acceptance criteria for production sampling.